Comparative performance of intel processors. Generations of Intel processors: description and characteristics of models
Almost every year a new generation of central processors enters the market Intel Xeon E5. Each generation alternates the socket and technological process. There are more and more nuclei, and heat generation is gradually decreasing. But a natural question arises: “What does the new architecture give to the end user?”
To do this, I decided to test the performance of similar processors of different generations. I decided to compare models from the mass segment: 8-core processors 2660, 2670, 2640V2, 2650V2, 2630V3 and 2620V4. Testing with such a generational spread is not entirely fair, because Between V2 and V3 there is a different chipset, a new generation of memory with a higher frequency, and most importantly, there are no direct peers in frequency among the models of all 4 generations. But, in any case, this study will help to understand to what extent the performance of new processors has increased in real applications and synthetic tests.
The selected line of processors has many similar parameters: the same number of cores and threads, 20 MB SmartCache, 8 GT/s QPI (except 2640V2) and the number of PCI-E lanes equal to 40.
To assess the feasibility of testing all processors, I turned to the results of the PassMark tests.
Below is a summary graph of the results:

Since the frequency is significantly different, it is not entirely correct to compare the results. But despite this, conclusions immediately arise:
1. 2660 is equivalent in performance to 2620V4
2. 2670 is superior in performance to 2620V4 (obviously due to frequency)
3. 2640V2 sags, and 2650V2 beats everyone (also due to frequency)
I divided the result by frequency and got a certain performance value at 1 GHz:

Here the results are more interesting and clear:
1. 2660 and 2670 - an unexpected turnaround for me within one generation, 2670 justifies only that overall performance he is very high
2. 2640V2 and 2650V2 - a very strange low result, which is worse than the 2660
3. 2630V3 and 2620V4 are the only logical growth (apparently due to new architecture...)
After analyzing the result, I decided to weed out some of the uninteresting models that are of no value for further testing:
1. 2640V2 and 2650V2 - an intermediate generation, and not very successful, in my opinion - I’m removing them from the candidates
2. 2630V3 is an excellent result, but it costs unreasonably more than 2620V4, given the similar performance and, moreover, this is the outgoing generation of processors
3. 2620V4 - reasonable price (compared to 2630V3), high performance and, most importantly, this is the only model of the latest generation 8-core processor with Hyper-threading on our list, so we definitely leave it for further tests
4. 2660 and 2670 - an excellent result in comparison with 2620V4. In my opinion, it is precisely the comparison of the first and last (in this moment) generations in Intel line Xeon E5 is of particular interest. In addition, we still have sufficient stocks of first-generation processors in our warehouse, so this comparison is very relevant for us.
The cost of servers based on 2660 and 2620V4 processors can differ by almost 2 times, not in favor of the latter, so by comparing their performance and choosing a server on V1 processors, you can significantly reduce the budget for purchasing a new server. But I will tell you about this proposal after the test results.
For testing, 3 stands were assembled:
1. 2 x Xeon E5-2660, 8 x 8Gb DDR3 ECC REG 1333, Intel SSD Enterprise 150Gb
2. 2 x Xeon E5-2670, 8 x 8Gb DDR3 ECC REG 1333, SSD Intel Enterprise 150Gb
3. 2 x Xeon E5-2620V4, 8 x 8Gb DDR4 ECC REG 2133, SSD Intel Enterprise 150Gb
PassMark PerformanceTest 9.0
When selecting processors for testing, I already used the results of synthetic tests, but now it’s interesting to compare these models in more detail. I made the comparison in groups: 1st generation versus 4th.
A more detailed testing report allows us to draw some conclusions:
1. Mathematics, incl. and floating point, mainly depends on frequency. The difference of 100 MHz allowed the 2660 to outpace the 2620V4 in computational operations, encryption and compression (and this despite the significant difference in memory frequency)
2. Physics and calculations using extended instructions are performed better on the new architecture, despite the low frequency
3. And, of course, the test using memory was in favor of V4 processors, since in this case different generations of memory were competing - DDR4 and DDR3.
It was synthetic. Let's see what specialized benchmarks and real applications show.
Archiver 7ZIP

Here the results have something in common with the previous test - a direct link to the processor frequency. It doesn’t matter that slower memory is installed - V1 processors confidently take the lead in frequency.
CINEBENCH R15
CINEBENCH is a benchmark for evaluating computer performance for working with professional program to create MAXON Cinema 4D animation.
The Xeon E5-2670 pulled up the frequency and beat the 2620V4. But the E5-2660, which has a not so visible advantage in frequency, lost to the 4th generation processor. Hence the conclusion - this software uses useful additions new architecture (although perhaps it’s all a matter of memory...), but not so much that it would be a decisive factor.
3DS MAX + V-Ray
To evaluate processor performance when rendering in a real application, I took a combination: 3ds Max 2016 + V-ray 3.4 + a real scene with several light sources, specular and transparent materials, and an environment map.
The results were similar to CINEBENCH: the Xeon E5-2670 showed the lowest rendering time, and the 2660 could not beat the 2620V4.
1C: SQL/File
At the end of the testing, I attach the results of the gilev tests for 1C.
When testing the database with file access The E5-2620V4 processor is confidently in the lead. The table shows the average values of 20 runs of the same test. The difference between the results of each stand in the case of a file database was no more than 2%.
Single thread test SQL databases showed quite strange results. The difference turned out to be insignificant, given the different frequencies of the 2660 and 2670, and the different frequencies of DDR3 and DDR4. There was an attempt to optimize the SQL settings, but the results turned out to be worse than they were, so I decided to test all the stands on basic settings.

The results of the multi-threaded SQL test turned out to be even more strange and contradictory. The maximum speed of 1 thread in MB/s was equivalent to the performance index in the previous single-threaded test.
The next parameter was maximum speed(all streams) - the result was almost identical for all stands. Since the results of different runs fluctuated greatly (+-5%) - sometimes they were at different stands with a significant gap in one direction or the other. The same average multi-threaded SQL test results lead me to 3 thoughts:
1. This situation is caused by an unoptimized SQL configuration
2. The SSD became a system bottleneck and did not allow the processors to overclock
3. There is almost no difference between the frequency of memory and processors for these tasks (which is extremely unlikely)
The result for the “Recommended number of users” parameter also turned out to be inexplicable. The average result of 2660 turned out to be the highest - and this despite the low results of all tests.
I will also be glad to see your comments on this issue.
conclusions
The results of several diverse computing tests showed that the processor frequency in most cases turned out to be more important than the generation, architecture, and even memory frequency. Of course there is modern software, which takes advantage of all the improvements of the new architecture. For example, video transcoding is sometimes performed incl. using AVX2.0 instructions, but this is specialized software - and most server applications are still tied to the number and frequency of cores.Of course, I’m not saying that there is no difference at all between processors, I just want to point out that for certain applications there is no point in a “planned” transition to a new generation.
If you disagree with me or have suggestions for testing, the stands have not yet been dismantled, and I will be happy to test your tasks.
Economic benefit
As I already wrote at the beginning of the article, we offer a line of servers based on first-generation Xeon E5 processors, which are significantly cheaper in cost than servers based on the E5-2620V4.These are the same new servers (not to be confused with used ones) with a 3-year warranty.
Below is an approximate calculation.
Part 1: 53 configurations with integrated graphics
Changing the year on the calendar, as a rule, leads to updating testing methods computer systems, and therefore - to summing up the results of testing central processors (which is a special case of testing systems) carried out in the past year. In principle, we received the bulk of the results long before the end of the year, but we wanted to add the “seventh generation” Core to the results (at least in limited quantities). Unfortunately, it was not possible to do this: the “original” method used in the tests according to the 2016 method Windows version 10 is not compatible with graphics Intel drivers, suitable for HD Graphics 630. More precisely, of course, the opposite: this driver requires at least the Anniversary Update. In principle, there is nothing new in this, latest versions graphic Nvidia drivers, for example, behave similarly, but changing the set of test bench software violates the concept of tests “in the closest possible conditions.” However, tests of new processors using the 2017 method have already shown that there is nothing truly “new” in them - as expected. Therefore, it is possible to do without the results of “Skylake Refresh” for now, which is what we will do.
The second point that should also be taken into account is the number of subjects. Last year's results presented the results of 62 processors, 14 of which were tested with two “video cards” - an integrated GPU (different for everyone) and a discrete Radeon R7 260X, and four with different types memory. In total there were 80 configurations. It’s not that difficult to “shove” them all into one article (after all, not so long ago we had 149 test configurations in one article ), but the diagrams were, to put it mildly, not very convenient to view. In addition, there is no great need for a direct comparison of the “atomic” Celeron N3150 and the extreme ten-core Core i7-6950X either: this is still fundamental different platforms. The “vastness” of the final articles using the “old” methods was mainly due to the fact that in the main line of tests all participants worked with the same discrete video card, but this approach was not always applicable before - as a result, some computer systems had to be removed into a separate line of tests, and then summarize individual testing results.
This year we decided to do the same. Today's article will present results from 53 different configurations: 47 processors, five of which were tested with two different types of memory, and one with at different levels TDP. But everything is done exclusively using the integrated GPU (also different for everyone). To some extent, this is a return to the results of 2014 - only there are more results. And in the near future, those who wish will be able to familiarize themselves with summary material based on testing 21 processors with the same Radeon R9 380. Some of the participants overlap, and in general the test results are “compatible” with each other, but to improve their perception, it seems to us, better two separate materials. Those readers who are only interested in dry numbers can (and for quite a long time) compare them in any set using the traditional one, which, by the way, also includes information on several “specialized” tests, adding which to the final materials is somewhat difficult.
Test bench configuration
Since there are many subjects, it is not possible to describe their characteristics in detail. After thinking a little, we decided from the usual short table refuse: anyway, it is becoming too vast, and at the request of the workers, we still put some parameters directly on the diagrams, just like last year. In particular, since some people are asking to indicate right there the number of cores/modules and computational threads running simultaneously, as well as operating clock frequency ranges, we tried to do just that, adding information about the thermal package at the same time. The format is simple: “cores (or modules)/threads; minimum-maximum clock frequency cores in GHz; TDP in Watts.”
Well, all other characteristics will have to be looked at in other places - the easiest way is from manufacturers, and prices - in stores. Moreover, prices for some devices are still not determined, since these processors themselves are not available in retail (all BGA models, for example). However, all this information is, of course, in our review articles devoted to these models, and today we are engaged in a slightly different task than the actual study of processors: we collect the data obtained together and look at the resulting patterns. Including paying attention to the relative position not of processors, but of entire platforms that include them. Because of this, the data in the diagrams is grouped precisely by platform.
Therefore, all that remains is to say a few words about the environment. As for memory, the fastest one supported by the specification was always used, with the exception of the case that we called “Intel LGA1151 (DDR3)” - processors for LGA1151, but paired with DDR3-1600, and not the faster (and “main” according to specifications) DDR4-2133. The amount of memory has always been the same - 8 GB. System storage () is the same for all subjects. As for the video part, everything has already been said above: this article used exclusively data obtained with the built-in video core. Accordingly, those processors that do not have it are automatically sent to the next part of the results.
Testing methodology
The technique is described in detail. Here we will briefly inform you that the main ones for the results are two “modules” out of four standard ones: and . As for gaming performance, it, as has been demonstrated more than once, is mainly determined by the video card used, so, first of all, these applications are relevant specifically for GPU tests, and discrete ones at that. For serious gaming applications, discrete video cards are still needed, and if for some reason you have to limit yourself to IGP, then you will have to take a responsible approach to choosing and configuring the game for a specific system. On the other hand, our “Integral” is quite suitable for quickly assessing the capabilities of integrated graphics. game result"(first of all, this is a qualitative, not a quantitative assessment), so we will give it too.
Let's pretend that detailed results all tests are available as . Directly in the articles we use relative results, divided into groups and normalized relative to the reference system (as last year, a laptop on Core based i5-3317U with 4 GB memory and 128 GB SSD). The same approach is used when testing laptops and other ready-made systems, so that all results in different articles (using the same version of the technique, of course) can be compared, despite different environments.
Working with video content
This group of applications traditionally gravitates towards multi-core processors. But when comparing formally identical models from different years of production, it is clearly visible that the quality of the cores is no less important here than their quantity, and the functionality (primarily) of the integrated GPU is also important here. However, fans maximum performance“there’s still nothing particularly encouraging: AMD has never played in this market (even in the company’s plans the fastest IGP processors will be deprived), and Intel has solutions for LGA115x, where the performance per thread and clock frequency gradually increases with the platform number, but at maintaining the formula “four cores - eight threads”, and the frequencies cannot be said to be growing very actively. As a result, a comparison of the Core i7-3770 and Core i7-6700K gives us a 25% increase in performance over five years: the same notorious “5% per year” that people usually complain about. On the other hand, in the Pentium G4520/G2130 pair the difference is already quite significant 40%, and the new models of these processors for LGA1151 have acquired support for Hyper-Threading, so they behave like the Core i3-6100 with all that it implies. In the field of nettop-tablet solutions, there is still room for intensive methods of increasing productivity, which is brilliantly demonstrated by the Celeron J3455, which is already outperforming some fully desktop processors. In general, progress in different market segments is proceeding at different speeds, but the reasons for this have long been and repeatedly voiced: desktop computers have ceased to be the main intended purpose, and the times when it was necessary to increase productivity at any cost, since it was, in principle, not enough to solve the problems of mass users, also ended in the last decade. There are, of course, server platforms, but (again, unlike the situation at the end of the last century), this has long been a separate area, where considerable attention is also paid to efficiency, and not just performance.
Digital Photo Processing

We continue to observe similar trends, adjusted for the fact that Photoshop, for example, has only partial multi-threaded optimization. But some of the filters used actively use new sets of commands, so to some extent one compensates for the other in the case of budget desktop processors, but not “atomic” » platforms. In general, there is an increase in performance over a long time interval, and with a certain devaluation of old processor families (Core i7 for LGA1155 is approximately Core i5 for LGA1151), but the global “breakthroughs” that some “potential buyers” have been dreaming of have been around for a long time not anymore. Perhaps they are not there because changes generally occur only in the Intel assortment, and even those are planned :)
Vector graphics

From using Adobe We abandoned Illustrator in the new version of the methodology, and the final diagram clearly shows the reason for this decision: the last thing this program was seriously optimized for was Core 2 Duo, so for work (note: this is not a household application, and a very expensive one), a modern one is quite sufficient Celeron or five-year-old Pentium, but even if you pay seven times more, you can only get one and a half times the speedup. In general, although in this case the performance is interesting to many, there is no point in testing it - in such a narrow range it is easier to assume that all colas are the same:) The only “in-flight” solutions are “atomic” solutions - it’s not for nothing that it was said about them for 10 years in a row that they are intended for consuming content, and not for producing it.
Audio processing
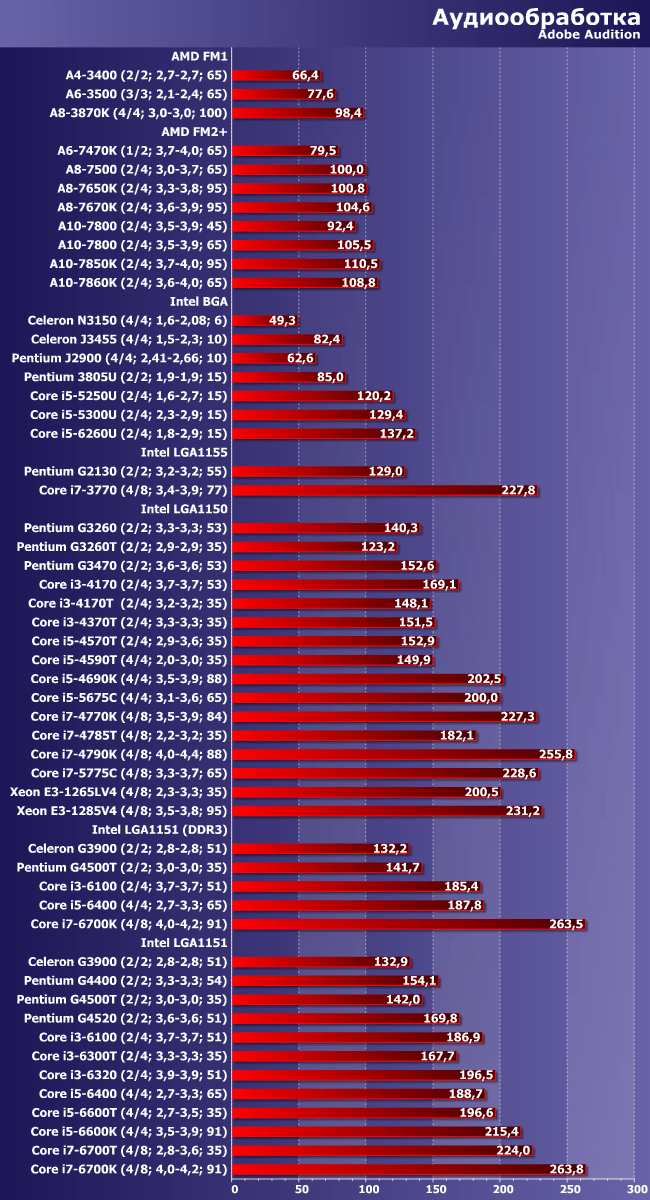
Adobe Audition is another program that, starting this year, is leaving the list of those we use in testing. The main complaint against it is the same: it is achieved too quickly “ required level performance” and “maximum” differs too little from it. Although the difference between Celeron and Core i7 in each iteration of LGA115x is already approximately twofold, it is easy to see that most of it is still “made up” within, if not budget, then inexpensive processor lines. Moreover, the above is true only for Intel processors- the application is generally somewhat biased towards today's AMD platforms.
Text recognising

The times of rapid progress in character recognition technologies are long gone, so the corresponding applications are developed without changing the basic algorithms: they, as a rule, are integer and do not use new instruction sets, but they scale well in terms of the number of computational threads. The second provides a good spread of values within the platform - up to three times, which is close to the maximum possible (after all, the effect of code parallelization is usually not linear). The first does not allow us to notice a significant difference between processors of different generations of the same architecture - a maximum of 20 percent over five years, which is even less than the “average”. But processors of different architectures behave differently, so this application continues to be an interesting tool.
Archiving and unarchiving data

Archivers have also, in principle, reached such a level of productivity that in practice you can no longer pay attention to their speed. On the other hand, they are good because they quickly respond to changes in performance characteristics within the same processor family. But comparing different ones is a dangerous task: the fastest among those we tested (of those included in today’s article, of course) turned out to be the Core i7-4970K for an already formally “outdated” platform. And not everything is going smoothly in the “atomic” family either.
File operations
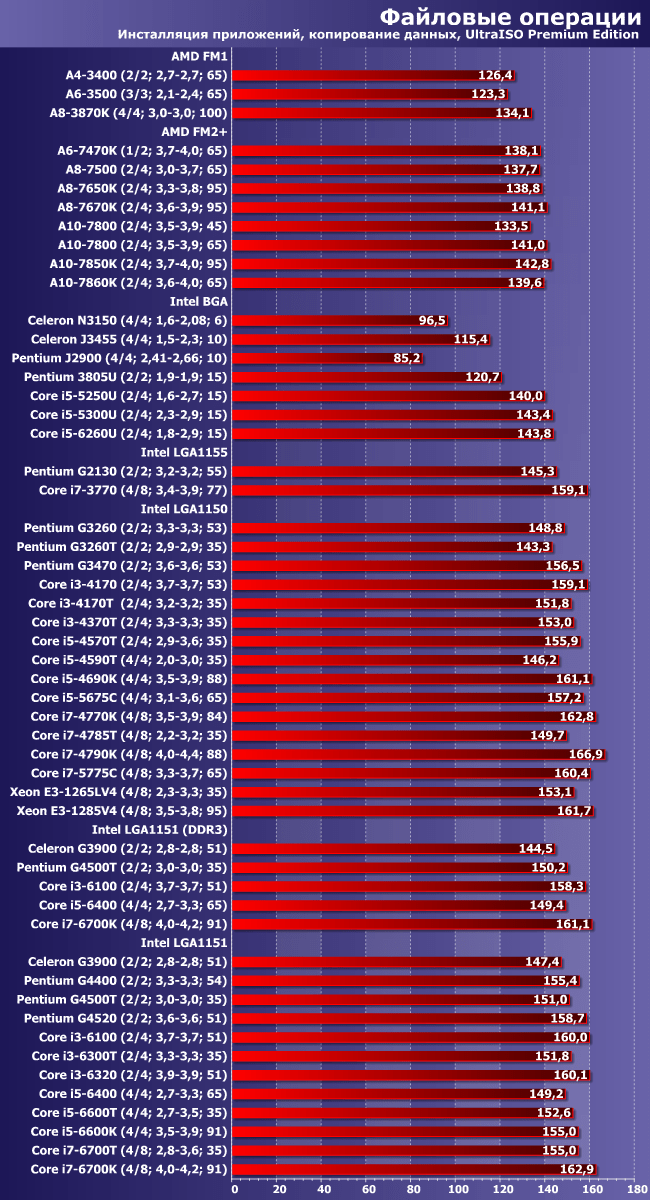
The diagram clearly shows why, from 2017, these tests will no longer be taken into account in the overall score and will “go” into their own: with the same fast drive, the results are too even. In principle, this could have been assumed a priori, but it didn’t hurt to check. Moreover, as we see, the results are smooth, but not perfectly smooth: “surrogate” solutions, low-end mobile processors and old AMD APUs do not squeeze the maximum out of the SSD used. In their case, SATA600 is supported, so no one seems to be stopping you from copying data at least at the same speed as “adult” platforms, but there is a decrease in performance. More precisely, it was until recently, but now it ceases to matter.
Scientific calculations

Questions regularly arose in the forum regarding the use of SolidWorks Flow Simulation for testing low-cost systems, but in general the results of this program are quite interesting: as we see, it scales well across cores, but only across “physical” ones - different implementations SMT is contraindicated for her. From a methodological point of view, the case is interesting, but not unique; while most of the programs in our set are, if they are multi-threaded, then fully multi-threaded. But overall, the results of this scenario fit into the overall picture.
iXBT Application Benchmark 2016

So, what do we have in the bottom line? Mobile processors are still a thing in themselves: they have the same performance as desktop processors, but of lower classes. There is nothing unexpected in this - but their energy consumption is significantly lower. The performance increase between similarly positioned desktop Intel processors over five years is 20-30%, and the more “top-end” the family, the slower it grew. This, however, does not in any way interfere with “social justice”: it is precisely in the budget segment that higher performance is needed, as well as more powerful graphics (there may simply not be enough money for discrete graphics). In general, thrifty buyers are lucky - one might say, the primary focus on laptop computers contributed to budget desktops as well. And not only in performance and purchase price, but also in cost of ownership.
In any case, this is true for Intel solutions - the second remaining manufacturer of x86 processors on the market has been doing worse in recent years, to put it mildly. FM1 is a five-year-old solution, FM2+ until the end of 2016 remained the company’s most modern and powerful integrated platform, but they differ... literally by the same 20% as different Core generation i7. However, it cannot be said that nothing has changed at all over the past years: the graphics have become more powerful, and energy efficiency has increased, but gaming has remained the main niche of these processors. Moreover, for graphics performance at the level of low-end discrete video cards, you have to pay with both low performance of the processor part and high energy consumption - which is what we are just moving on to.
Energy consumption and energy efficiency
In principle, the diagram clearly explains why budget processors“grow” in speed faster than “non-budget” ones: energy consumption is limited more than, generally speaking, necessary for desktop computers(although this is better than the horrors of the 90s and zeros), the relative share of “full-size desktops” has also decreased greatly over the past years and continues to fall. And for laptops or tablets, even older “atomic” models are no longer very comfortable - not to mention quad-core Core ones. Which, in a good way, is long overdue to be made a main mass product - you see, the software industry will find useful use for such power.

Let's note that not only efficiency increased - first of all, energy efficiency increased, since it took more time to solve any problem in the same or even less time. modern processors spend less energy. Moreover, working quickly is useful: in energy saving mode you will be able to stay longer. Let us recall that these technologies began to be actively used in mobile processors- when did such a division even exist, because now all processors are like this to a certain extent. AMD has the same trend, but in this case the company failed to repeat the success of at least Sandy Bridge, as a result of which the most “tasty” market segments were lost. Let's hope that the release of processors and APUs based on a new microarchitecture and a new technical process will solve this problem.
iXBT Game Benchmark 2016
As stated in the description of the methodology, we will limit ourselves to a qualitative assessment. At the same time, let’s recall its essence: if the system demonstrates a result above 30 FPS at a resolution of 1366×768, it receives one point, and for the same thing at a resolution of 1920×1080, it receives two more points. Thus, given that we have 13 games, the maximum score can be 39 points - it does not mean that the system is a gaming system, but such a system, according to at least, passes 100% of our gaming tests. It is by the maximum result that we will standardize all the others: we calculated the points, multiplied by 100, divided by 39 - this will be the “Integral game result”. For really gaming systems, it is not needed, since everyone there is more interested in the nuances, but for assessing “universal” ones it will do just fine. It turned out to be more than 50 - which means that sometimes you can play something more or less comfortably; about 30 - even lowering the resolution will not help; Well, if it’s 10-20 points (not to mention zero), then it’s better not to even mention games with more or less 3D graphics.

As we can see, with this approach everything is simple: only AMD APUs for FM2+ (most likely FM2) or any Intel processors with fourth-level cache (with eDRAM) can be considered “conditionally gaming” solutions. The latter are faster, but quite specific: firstly, they are quite expensive (it’s easier to buy inexpensive processor And discrete video card, which will provide higher comfort in games), secondly, most of them have a BGA design, so they are sold only as part of ready-made systems. AMD, on the other hand, plays on a different field - its desktop A8/A10 are practically no alternative if you need to build a computer that is more or less suitable for games, but has a minimal cost.
Others Intel solutions, as well as younger (A4/A6) and/or outdated AMD APUs, it is better not to consider them as gaming solutions at all. Which does not mean that their owner will have absolutely nothing to play with - but the entire assortment available games will also include either old or undemanding applications for graphics performance. Or both at once. For other things, they will have to purchase at least an inexpensive discrete video card - but not the cheapest, since “low-end” solutions (as has been shown more than once in the relevant reviews) are comparable to the best integrated solutions, that is, money will be wasted.
Total
In principle, we made the main conclusions about processor families directly in their reviews, so they are not required in this article - this is primarily a generalization of all previously obtained information, nothing more. More precisely, almost all of them - as mentioned above, we have postponed some systems for a separate article, but there will be fewer of them there, and the systems will be less widespread. The main segment is here. In any case, if we talk about desktop systems, which now come in different designs.
Generally speaking, the past year, of course, was quite poor in terms of processor events: both Intel and AMD in the mass market continued to sell what debuted in 2015, or even earlier. As a result, many participants in these and last year’s results turned out to be the same - especially since we tested the “historical” platforms once again (we hope that in last time:)) But the slowest last year was the Celeron N3150: 54.6 points, and the fastest was the Core i7-6700K: 258.4 points. In this regard, the positions did not change, and the results actually remained the same - 53.5 and 251.2 points. The top-end system had it even worse :) Note: this is despite a significant reworking of the software used, and precisely in the direction of the most demanding tasks on the computer’s performance. The budget “old man” in the person of the Pentium G2130, on the contrary, grew from 109 to 115 points over the year, just as the “non-budget old man” Core i7-3770 began to look even a little more attractive than before after a software update. On this, in fact, the idea of acquiring “productivity for the future” can be closed - if someone has not already done this;)

Best processor for gaming | Benefit reduction effect
Prices for high-end processors are rising rapidly, but the performance gains in games will be less and less. Therefore, it is hardly worth recommending a processor more expensive than the Core i5-7600K. Moreover, if there is good cooler this model can be overclocked to 5 GHz if higher performance is required.
However, there are a small number of games that take advantage of Core i7 processors Hyper-Threading technology. We believe the trend of multi-core gaming optimization will continue, which is why we've added the Core i7-5820K to the list. For most games there won't be much difference between a Core i7 and a Core i5, but if you're the kind of enthusiast who wants future-proofing and high-end performance multi-threaded applications, this CPU may incur additional costs.
With the advent of the LGA 2011-v3 interface, there is every reason to build an unsurpassed gaming platform on its basis. Haswell-E-based processors have more available cache and four more cores compared to leading LGA 1150/1155 socket models. In addition, thanks to the four-channel controller, greater throughput memory. With 40 Gen 3 PCIe lanes available on Sandy Bridge-E processors, the platform natively supports two x16 slots and one x8 slot, or one x16 slot and three x8 slots, eliminating potential " narrow places"in CrossFire or SLI configurations for three and four video cards.
While all of the above sounds impressive, it does not necessarily lead to a significant increase in productivity in modern games. Our tests show very little difference between the $240 LGA 1150 Core i5-4690K and the $1000 LGA 2011 Core i7-4960X, even with three SLI graphics cards installed. It turns out that memory bandwidth and PCIe do not greatly affect the performance of current Sandy Bridge architecture systems.
Where Haswell-E really shines is in CPU-intensive games like Battlefield 1's multiplayer. If you're running three or four graphics cards, chances are you already have enough performance. An overclocked Core i7-5960X or Core i7-5930K can help the rest of the platform catch up to the extremely powerful video system.
In general, although we do not recommend buying a processor more expensive than the Core i5-7600K in terms of price/performance ratio (the money saved can be spent on graphics adapter and motherboard), there will always be those who will spare no expense in the pursuit of achieving the highest possible performance.
Best processor for gaming | comparison table
What about other processors that aren't on our list of recommendations? Are they worth buying or not?
Such questions are quite appropriate, since accessibility different models and their prices change daily. How to Know if the Processor You've Got Your Eyes on Will Be best buy in this price range?
We decided to help you in this difficult task by presenting a CPU hierarchy table, where processors of the same gaming performance level are on the same line. The top lines show the most powerful gaming CPUs, and as you move down the lines, performance decreases.
Proposed hierarchical table various models processors Intel and AMD were initially based on the average performance of each in our benchmark suite. We later added new game data as part of the evaluation criteria, but keep in mind that different games behave differently due to their unique characteristics. program code. For example, some of them are extremely dependent on graphics power, but others respond positively to larger number cores, cache memory, or even a specific architecture.
We don't have the ability to test every CPU on the market, so in some cases rankings will depend on the results of similar models. Essentially, this hierarchical table is useful as a general selection guide, but it is not universal remedy comparisons of different processors. For more detailed information, please refer to (English) or to the regularly updated section " Best CPU for Gaming: Current Market Analysis ".
You may have noticed that we have divided the flagship section into two levels processors and on one of them they placed several quad-core AMD models. Given that many older platforms can be used with several different generations of graphics subsystems, we wanted to highlight the highest-performance models to maintain a balance between the system and the video accelerator. For example, at the moment, any owner of a Sandy Bridge generation Core i7 will feel a significant increase when switching to Kaby Lake or Broadwell-E. And the flagship premises processors AMD's FX series being one step up from several Core i7s and older Core i5s means their status has risen.
Hierarchy of Intel and AMD processors | Table
| Intel | AMD |
| Core i7-3770, -3770K, -3820, -3930K, -3960X, -3970X, -4770, -4771, -4790, -4770K, -4790K, -4820K, -4930K, -4960X, -5775C, -5820K, 5930K, -5960X, -6700K, -6700, -7700K, -7700, -6800K, -6850K, -6900K, -6950X Core i5-7600K, -7600, -7500, -7400, -6600K, -6600, -6500, -5675C, -4690K, 4670K, -4590, -4670, -4570, -4460, -4440, -4430, -3570K, -3570, -3550 |
|
| Core i7-2600, -2600K, -2700K, -965, -975 Extreme, -980X Extreme, -990X Extreme Core i5-3470, -3450P, -3450, -3350P, -3330, 2550K, -2500K, -2500, -2450P, -2400, -2380P, -2320, -2310, -2300 |
FX-9590, 9370, 8370, 8350, 8320, 8300, 8150 |
| Core i7-980, -970, -960 Core i7-870, -875K Core i3-7350K, -7320, -7300, -7100, -4360, -4350, -4340, -4170, -4160, -4150, -4130, -3250, -3245, -3240, -3225, -3220, -3210 , -2100, -2105, -2120, -2125, -2130 Pentium G4620, G4600, G4560 |
FX-6350, 4350 Phenom II X6 1100T BE, 1090T BE Phenom II X4 Black Edition 980, 975 |
| Core i7-860, -920, -930, -940, -950 Core i5-3220T, -750, -760, -2405S, -2400S Core 2 Extreme QX9775, QX9770, QX9650 Core 2 Quad Q9650 |
FX-8120, 8320e, 8370e, 6200, 6300, 4170, 4300 Phenom II X6 1075T Phenom II X4 Black Edition 970, 965, 955 A10-6800K, 6790K, 6700, 5800K, -5700, -7700K, -7800, -7850K, 7870K A8-3850, -3870K, -5600K, 6600K, -7600, -7650K Athlon X4 651K, 645, 641, 640, 740, 750K, 860K |
| Core 2 Extreme QX6850, QX6800 Core 2 Quad Q9550, Q9450, Q9400 Core i5-650, -655K, -660, -661, -670, -680 Core i3-2100T, -2120T |
FX-6100, -4100, -4130 Phenom II X6 1055T, 1045T Phenom II X4 945, 940, 920 Phenom II X3 Black Edition 720, 740 A8-5500, 6500 A6-3650, -3670K, -7400K Athlon II X4 635, 630 |
| Core 2 Extreme QX6700 Core 2 Quad Q6700, Q9300, Q8400, Q6600, Q8300 Core 2 Duo E8600, E8500, E8400, E7600 Core i3 -530, -540, -550 Pentium G3470, G3460, G3450, G3440, G3430, G3420, G3260, G3258, G3250, G3220, G3420, G3430, G2130, G2120, G2020, G2010, G870, G860, G850, G840, G645, 40, G630 |
Phenom II X4 910, 910e, 810 Athlon II X 4 620, 631 Athlon II X3 460 |
| Core 2 Extreme X6800 Core 2 Quad Q8200 Core 2 Duo E8300, E8200, E8190, E7500, E7400, E6850, E6750 Pentium G620 Celeron G1630, G1620, G1610, G555, G550, G540, G530 |
Phenom II X4 905e, 805 Phenom II X3 710, 705e Phenom II X2 565 BE, 560 BE, 555 BE, 550 BE, 545 Phenom X4 9950 Athlon II X 3 455, 450, 445, 440, 435, 425 |
| Core 2 Duo E7200, E6550, E7300, E6540, E6700 Pentium Dual-Core E5700, E5800, E6300, E6500, E6600, E6700 Pentium G9650 |
Phenom X4 9850, 9750, 9650, 9600 Phenom X3 8850, 8750 Athlon II X2 265, 260, 255, 370K A6-5500K A4-7300, 6400K, 6300, 5400K, 5300, 4400, 4000, 3400, 3300 Athlon 64 X2 6400+ |
| Core 2 Duo E4700, E4600, E6600, E4500, E6420 Pentium Dual-Core E5400, E5300, E5200, G620T |
Phenom X4 9500, 9550, 9450e, 9350e Phenom X3 8650, 8600, 8550, 8450e, 8450, 8400, 8250e Athlon II X2 240, 245, 250 Athlon X2 7850, 7750 Athlon 64 X2 6000+, 5600+ |
| Core 2 Duo E4400, E4300, E6400, E6320 Celeron E3300 |
Phenom X4 9150e, 9100e Athlon X2 7550, 7450, 5050e, 4850e/b Athlon 64 X2 5400+, 5200+, 5000+, 4800+ |
| Core 2 Duo E5500, E6300 Pentium Dual-Core E2220, E2200, E2210 Celeron E3200 |
Athlon X2 6550, 6500, 4450e/b, Athlon X2 4600+, 4400+, 4200+, BE-2400 |
| Pentium Dual-Core E2180 Celeron E1600, G440 |
Athlon 64X 2 4000+, 3800+ Athlon X2 4050e, BE-2300 |
| Pentium Dual-Core E2160, E2140 Celeron E1500, E1400, E1200 |
Currently our table consists of 13 levels. The bottom half of the list is mostly no longer relevant: these chips will demonstrate insufficient performance in modern games, regardless of installed video card. If your CPU belongs to this half of the list, then the upgrade will really increase your enjoyment of the games.
In fact, only chips in five upper levels can be considered suitable for games today. And in this upper part of the table, the meaning of an upgrade only appears if you choose CPU at least two levels higher. Otherwise, the improvements won't be enough to justify the cost of a new CPU, motherboard and memory, not to mention the graphics card and storage drives that you'll also be considering replacing.
|
The result is banal: judge the performance of anyone central processor It is not possible based on just one parameter. Only a set of characteristics gives an understanding of what kind of chip it is. Narrowing down the processors to consider is very easy. AMD's modern ones include FX chips for the AM3+ platform and A10/8/6 hybrid solutions of the 6000 and 7000 series (plus Athlon X4) for FM2+. Intel has Haswell processors for the LGA1150 platform, Haswell-E (essentially one model) for LGA2011-v3 and the latest Skylake for LGA1151. AMD processorsI repeat, the difficulty in choosing a processor lies in the fact that there are a lot of models on sale. You simply get confused in this variety of markings. AMD has hybrid processors A8 and A10. Both lines include only quad-core chips. But what's the difference? Let's talk about this. Let's start with positioning. AMD FX processors are top chips for the AM3+ platform. Gaming system units and workstations are assembled on their basis. Hybrid processors (with built-in video) of the A-series, as well as Athlon X4 (without built-in graphics) are mid-class chips for the FM2+ platform. The AMD FX series is divided into quad-core, six-core and eight-core models. All processors do not have a built-in graphics core. Therefore, for a complete assembly you will need either motherboard with built-in video, or a discrete 3D accelerator. One day, a great sage in captain's uniform said that a computer would not be able to work without a processor. Since then, everyone has considered it their duty to find the very processor that will make their system fly like a fighter. From this article you will learn: Since we simply cannot cover all the chips known to science, we want to focus on one interesting family of the Intelovich family - Core i5. They have very interesting characteristics and good performance. Why this series and not i3 or i7? It's simple: excellent potential without overpaying for unnecessary instructions that plague the seventh line. And there are more cores than in the Core i3. It’s quite natural for you to start arguing about support and find yourself partially right, but 4 physical cores can do much more than 2+2 virtual ones. History of the series
I would like to start with the fact that only desktop processors will be considered, and not options for a laptop. Comparison mobile chips there will be, but another time. The release frequency table looks like this:
2009
The differences between the architectures lie in the fact that Westmare are built according to 32 nm process standards and have 2nd generation gates. And they have less energy consumption. 2011This year saw the release of the second generation of processors - Sandy Bridge. Their distinctive feature became the presence of a built-in Intel HD 2000 video core. Among the abundance of i5-2xxx models, I especially want to highlight the CPU with the 2500K index. At one time, it created a real sensation among gamers and enthusiasts, combining a high frequency of 3.2 GHz with support Turbo Boost and low cost. And yes, under the cover there was solder, not thermal paste, which additionally contributed to the high-quality acceleration of the stone without consequences. 2012
Integrated graphics have evolved to Intel HD 4000. The most interesting solution on this platform was the Core i5-3570K with an unlocked multiplier and a frequency of up to 3.8 GHz in boost. 2013The Haswell generation did not bring anything supernatural except the new LGA 1150 socket, AVX 2.0 instruction set and new graphics HD 4600. In fact, the entire emphasis was placed on energy saving, which the company managed to achieve. But the fly in the ointment is the replacement of solder with a thermal interface, which greatly reduced the overclocking potential of the top i5-4670K (and its updated version 4690K from the Haswell Refresh line). 2015Essentially this is the same Haswell, transferred to 14 nm architecture. 2016
Among the processors, it is worth highlighting the i5-6600K and 6400T. The first was loved for its high frequencies and unlocked multiplier, and the second for its low cost and extremely low heat dissipation of 35 W despite Turbo Boost support. 2017The Kaby Lake era is the most controversial because it brought absolutely nothing new to the desktop processor segment except native support for USB 3.1. Also, these stones completely refuse to run on Windows 7, 8 and 8.1, not to mention older versions. The socket remains the same - LGA 1151. And the set of interesting processors has not changed - 7600K and 7400T. The reasons for people's love are the same as for Skylake. 2018
Of the entire collection, the i5-8600K model is considered the most interesting for its ability to overclock up to 4.3 GHz (though only 1 core). However, the public prefers the i5-8400 as the cheapest entry ticket. Instead of resultsIf we were asked what we would offer to the lion's share of gamers, we would say without hesitation that the i5-8400. The advantages are obvious:
Additionally, you don’t have to select a “specific” RAM, as for the Ryzen 1600 (the main competitor, by the way), and even the cores themselves in Intel. You lose additional virtual streams, but practice shows that in games they only reduce FPS without introducing certain adjustments to the gameplay. By the way, if you don’t know where to buy, I recommend paying attention to some very popular and serious online store- at the same time you can find your way around the prices for i5 8400, periodically I buy various gadgets here myself. In any case, it's up to you. Until next time, don't forget to subscribe to the blog.
| ||||||||||||||||||||||||||||||||||||||||||||||||||||||||||||||||
 Today on our agenda is a comparison of Intel Core i5 processors of different generations. Here I would like to touch upon such pressing topics as the thermal package and the presence of solder under the lid. And if we’re in the mood, we’ll also push particularly interesting stones together. So, let's go.
 The first representatives of the series were released back in 2009. They were created on 2 different architectures: Nehalem (45 nm) and Westmere (32 nm). The brightest representatives of the line are the i5-750 (4×2.8 GHz) and i5-655K (3.2 GHz). The latter additionally had an unlocked multiplier and the ability to overclock, which indicated its high performance in games and more.
 The debut of Ivy Bridge brought a 22-nanometer process technology, higher frequencies, new DDR3, DDR3L and PCI-E 3.0 controllers, as well as USB 3.0 support (but only for i7).
 The sixth iteration, under the name Skylake, introduced an updated LGA 1151 socket, support for DDR4 RAM, 9th generation IGP, AVX 3.2 and SATA Express instructions.
 Goffee Lake processors are fundamentally different from their predecessors. Four cores have been replaced by 6, which previously only the top versions of the i7 X series could afford. The L3 cache size was increased to 9 MB, and the thermal package in most cases does not exceed 65 W.