Reading windows dumps. Definition of the Blue Screen of Death error. BlueScreenView utility
Almost every Windows user has heard of or even seen the so-called “blue screen of death” (BSOD). This ominous term refers to the screen with a blue background that appears when Windows crashes or stops due to a catastrophic failure or internal situation that has made it impossible to further work systems.
In this chapter, we will look at the main reasons why Windows crashes, describe the information displayed on the "blue screen" and talk about the various configuration parameters that control the creation of crash dump fcrash dump) - copies system memory at the time of the crash, which can help determine which component caused the crash. B goals this section Not included detailed consideration How to identify and fix problems by analyzing a Windows crash dump. However, this section shows how to identify a malfunctioning driver or component by analyzing a crash dump. Basic crash dump analysis requires minimal effort and a few minutes of time. Dump analysis is worth carrying out, even if the problematic driver can only be identified on the fifth or tenth attempt: a successfully completed analysis will avoid data loss and system downtime.
Why does Windows crash?
Windows crash (system stop and blue screen) can be caused by the following reasons:
An unhandled exception caused by a device driver or a kernel-mode system function, such as a memory access violation (attempting to write to a read-only page or read to an address that has not yet been mapped and is therefore invalid);
Calling a kernel procedure, the result of which is the redistribution of processor time due, for example, to waiting on a busy kernel dispatcher object at an IRQL level of “DPC/dispatch” or higher (for IRQL, see Chapter 3);
Accessing data on a page unloaded from memory at an IRQL level of “DPC/dispatch” or higher (which requires the memory manager to wait for an I/O operation, and this, as already mentioned, is impossible at such IRQL levels, since it requires redistribution of processor time);
Explicitly causing a system crash by a device driver or system function (via the KeBugCheckEx) if damaged internal data is detected or in a situation where continued operation of the system threatens such damage;
A hardware error, such as a hardware control error or a Non-Maskable Interrupt (NMI). Microsoft analyzed crash dumps sent Windows users XP to the Microsoft Online Crash Analysis (OCA) website (more about it we'll talk in this chapter), and found that the causes of system failures are distributed as shown in the diagram in Fig. 14-1 (as of April 2004).
When a device driver or kernel-mode component throws an unhandled exception, Windows faces a difficult dilemma. Some part of the operating system, which has the right to access any hardware devices and any part of memory, did something that should not be done.
But why does Windows have to crash? Why not ignore this exception and let the drivers continue to work as if nothing had happened? After all, it is possible that the error was local in nature and the corresponding component will somehow be able to recover from it. However, it is much more likely that the exception encountered is due to a more serious problem, such as memory corruption or hardware failure. Then the further operation of the system will most likely lead to further more exceptions and data corruption on disks and others peripheral devices, and this is too risky.
"Blue screen"
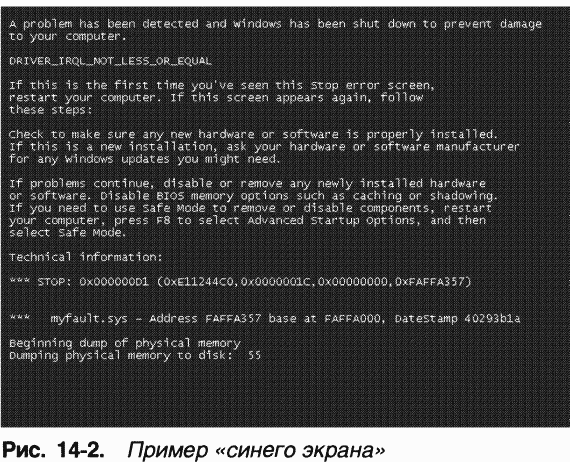
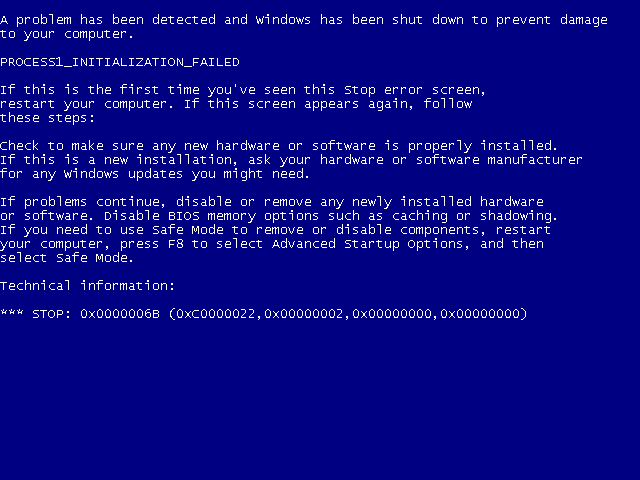
Regardless of the reason, the real system crash is caused by the function Ke-BugCbeckEx(documented in the Windows DDK). She takes the so-called stop code(stop code), or error check code(bug check code), and four parameters interpreted taking into account the stop code. KeBugCbeckEx masks all interrupts on all system processors, and then switches the video adapter to graphic mode VGA is low-resolution (supported by all Windows-compatible video cards) and displays a stop code value and several lines of text with recommendations on what to do next on a blue background. Finally, KeBugCbeckEx calls all registered ones (using the function KeRegisterBugCbeckCallback) device driver bug check callbacks so they can stop their devices. (System data structures may be so severely damaged that the blue screen may not occur.) A sample Windows XP blue screen is shown in Figure 1. 14-2.
NOTE B Windows XP Service Pack 1 (or higher) and Windows Server 2003 introduced the KeRegisterBugCheckReasonCallback function, which allows device drivers to add data to a crash dump or output crash dump information to an alternative device.
In Windows 2000, KeBugCheckEx displays a text representation of the stopcode, it numeric value and four options at the top of the blue screen, but in Windows XP and Windows Server 2003, the numeric value and options are shown at the bottom of the blue screen.
The first line displays the stop code and the values of four additional parameters passed to KeBugCheckEx. The line at the top of the screen is the text equivalent of the stop code's numeric identifier. In the example in Fig. 14-2 stop code 0x000000D1 corresponds to IRQL_NOT_ LESS_OR_ EQUAL. If the parameter contains the address of part of the operating system or device driver code (as in Figure 14-2), Windows displays the base address of the corresponding module, the date, and the name of the driver file. This information alone may be enough to identify the faulty component.
Although there are more than a hundred stop codes, most of them are very rarely or never found in production systems. The reasons for Windows crash can be represented by a fairly small group of stop codes. In addition, do not forget that the meaning of additional parameters depends on the specific stop code (but not all stop codes provide extended information transmitted through these parameters). However, analysis of the stop code and parameter values (if any) can, according to at least, help identify the faulty component (or hardware device causing a crash).
The information needed to interpret stop codes can be found in the Bug Checks section. Blue Screen s)" Windows Debugging Tools help file. (For information about Windows Debugging Tools, see Chapter 1.) You can also search the Microsoft Knowledge Base for the stop code and name of the problematic device or application (http://supportmicrosoft.com). In it you can find information about how to fix the error, about updates or service packages, solving the problem, which you encountered. The Bug-codes.h file in the Windows DDK contains full list of approximately 150 stop codes with detailed description some of them.
Blue screens often occur after installing a new software or equipment. If you see a blue screen immediately after installing a new driver on your early stage reboot, you can return the previous system configuration by pressing F8 and selecting from Advanced boot menu Last Known Good Configuration command. Windows then uses a copy of the registry key where the device drivers were registered (HKLM\SYSTEM\CurrentControlSet\Services) the last time it successfully booted (before installing a new driver). The last known successful configuration is considered latest configuration, in which the loading of all services and drivers was successfully completed and at least one successful login was performed. (About the last successful configuration goes into more detail in Chapter 5.)
If this doesn't help and you continue to see blue screens, then the most obvious approach is to remove components installed before the first blue screen occurred. If some time has passed since installation or you have added several devices or drivers at the same time, pay attention to the driver names indicated in any parameters on the blue screen. If there is a link to recently installed components(for example, Scsiport.sys in the case of installing a new SCSI disk), the cause of the failure is most likely related to them.
Many driver names are quite cryptic, but you can figure out which devices or software components correspond given name. To do this, look at the registry key HKLM\SYSTEM\CurrentControlSet\ Services, where Windows stores registration information for each driver on the system, and try to find the name of the service and the device driver associated with it. The description of the found driver is contained in the DisplayName and Description parameters; the purpose of some drivers is also described here. Thus, the string “Virus Scanner” found in the DisplayName indicates that the driver is part of antivirus program. The list of drivers can also be displayed using the utility System Information(System Information): Expand the Software Environment node and select System Drivers ( System drivers).
However, more often than not, the information provided by the stop code and the parameters associated with it is not enough to eliminate the failure that leads to the crash of the system. Thus, to find out the exact name of the driver or system component causing the crash, you may need to analyze the kernel mode call stack. Because Windows defaults to a system crash after a reboot, and you're unlikely to have time to examine the blue screen information, Windows attempts to write crash information to disk for later analysis. This information is placed in crash dump files.
Crash dump files
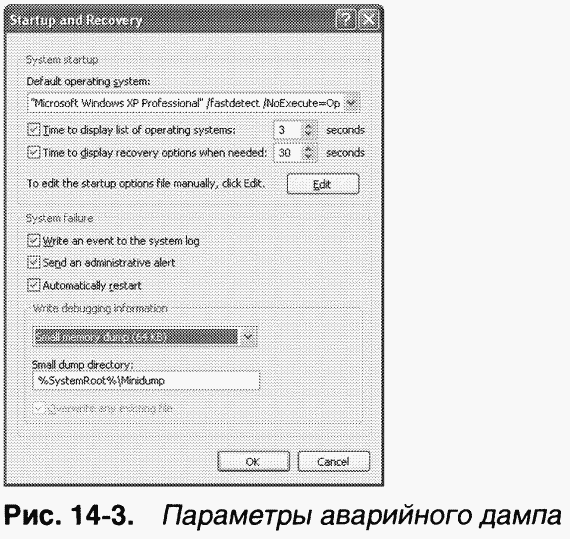
By default, all Windows systems are configured to record information about the state of the system at the time of the crash. The corresponding settings can be seen so open System in Control Panel(Control Panel), in the System Properties window, go to the Advanced tab and click the Startup And Recovery button. Ha fig. Figure 14-3 shows the default settings for Win systems dows XP Professional.
When a system crashes, three levels of information may be recorded.
Complete memory dump A full memory dump represents the entire contents physical memory at the time of the crash. For such a dump, the page file size must be equal to at least the amount of physical memory plus 1 MB (for the header). This option is least used because on systems with large amounts of memory the page file will be too large. Windows NT 4 only supports this type of crash dump file. Additionally, this setting is the default on Windows Server systems.
Kernel memory dump This version of the dump only includes the kernel mode pages (both read and write) that were in physical memory at the time of the crash. Pages owned by user processes are not included. Since only kernel-mode code can directly cause Windows to crash, the contents of user process pages usually provide little insight into the cause of the crash. In addition, all data structures used in crash dump analysis—the list of running processes, the current thread's stack, and the list of loaded drivers—are stored in non-paged memory, the contents of which are stored in the kernel memory dump. The size of a kernel memory dump cannot be predicted in advance because it depends on the amount of kernel memory allocated by the operating system and drivers.
Small memory dump The size of this dump (the default option on systems Windows Professional) is 64 KB (128 KB on 64-bit systems). This dump is still called a minidump(minidump) or minimal dump(triage dump). It includes a stop code with parameters, a list of loaded device drivers, data structures describing the current process and thread (PROCESS and ETHREAD, which are discussed in Chapter 6), and the kernel stack of the crashing thread. A full memory dump is a superset of the other two dumps, but it has the disadvantage that its size depends on the amount of physical memory on the system and can therefore be too large. Powerful server systems equipped with several gigabytes of memory are not that uncommon. The full crash dump files they record will be too large to upload to an FTP server or burn to a CD. Since most user-mode code and data are not used when analyzing crash dumps (after all, crashes are caused by kernel memory problems; system data structures are also contained in kernel memory), most of the data stored in a full memory dump is not needed for analysis and wastefully increases the size of the dump file. Finally, another disadvantage is that the page file size is boot volume(containing the \Windows directory) must be equal to the amount of physical memory on the system plus 1 MB. Since the need for a page file generally decreases as physical memory increases, this requirement means that the page file will be unnecessarily large. Therefore, we have to admit that it is better to use a small memory dump or a kernel memory dump.
The advantage of a minidump is its small size, which makes it convenient, for example, to transmit a dump via email. Each time a crash occurs, a file with a unique name is written to the \Windows\Minidump directory, starting with the string "Mini", followed by the date and serial number(for example Mini082604-01.dmp). The disadvantage of minidumps is that before analyzing them, you need exactly the images that were used by the system that generated the dump. (Even the most basic analysis requires, at a minimum, a copy of the corresponding Ntoskrnl.exe.) This can become a problem if you are analyzing the dump on a system other than the one on which it was created. However, on the server Microsoft characters There are images (and symbols) for Windows XP and later systems, so you can set the image path in the debugger to point to the symbol server, and the debugger will automatically download the necessary images. (Of course, the Microsoft symbol server does not have images of the drivers you are installing third party manufacturers.)
More significant drawback- such a dump contains a limited amount of data, which may interfere with effective analysis. You can work with minidumps even if you have configured the system to generate a kernel memory dump or a full dump - simply open a larger dump in Windbg and extract the minidump with the command .dump /t. Note: In Windows XP and Windows Server 2003, a minidump is automatically generated even if the system is configured to generate a full memory dump or a kernel memory dump.
NOTE By executing the command. dump in Livekd, you can generate a memory image of a running system so that, without stopping the system, you can get a dump for analysis in offline mode. This approach is useful when the system is experiencing problems, but it continues to serve customers and you would like to resolve the problems without interrupting service. The resulting dump will not necessarily be completely correct, since the contents various areas memory is retrieved at different times, but may contain information useful for analysis.
The golden mean is a kernel memory dump. It contains all of the physical kernel-mode memory, and therefore allows for the same level of analysis as a full memory dump, but does not contain user-mode code and data typically irrelevant to the problem, and is therefore significantly smaller in size. So, in a system with 256 MB of memory under Windows control XP kernel memory dump takes 34 MB, and on a system with Windows XP and 1.5 GB of memory this dump requires 72 MB.
When you configure the kernel memory dump settings, the system checks to see if the page file size is sufficient (according to Table 14-1), but these are just estimates because the size of the kernel memory dump cannot be predicted. The reason it is not possible to determine the size of a kernel memory dump in advance is that the size depends on the amount of kernel mode memory used by the operating system and drivers running on the computer at the time of the crash.

Thus, it may be that when the system crashes, the page file will be too small to contain the core dump. If you want to know the core dump size for your system, crash the system manually: configure the system so that you can manually crash it from the console, or use the Notmyfault program. (This chapter describes both approaches.) After the reboot, you can check to see if a kernel memory dump has been generated and, based on its size, estimate what the page file size should be for your boot volume. For consistency, you can set the page file size for 32-bit systems to 2 GB plus 1 MB, since 2 GB is maximum size kernel mode address space.
Finally, even if the system successfully writes a crash dump to a page file in the event of a crash, there must be enough disk space to retrieve the dump file. If there is not enough space, the crash dump will be lost because the page file space it used will be freed and overwritten when the system starts using the page file. If there is not enough space on the boot volume to save the memory.dmp file, you can set the path on another hard drive in the dialog box shown in Figure. 14-3.
Generating a crash dump
When the system boots, it obtains crash dump settings from the registry key HKLM\System\CurrentControlSet\Control\CrashControl. If dump generation is specified, the system creates a copy of the disk miniport driver used to write the boot volume into memory and gives it the same name as the miniport, but with the prefix "dump". In addition, the system calculates and stores a checksum for the components used when writing a crash dump: the copied disk driver miniport, the I/O manager functions that write the dump, and a map of the area in which the page file is located on the boot volume. When the function is called KeBugCheckEx, it recalculates the checksum and compares the new checksum with the one received during boot. If they do not match, the function does not write a crash dump, as this could result in a disk failure or data corruption on the disk. If checksums coincided KeBugCheckEx writes dump information directly to disk sectors occupied by the page file, bypassing the driver file system(which is possibly corrupted or even causing the crash).
When SMSS enables paging during the boot process, the system checks to see if the page file on the boot volume contains a crash dump and protects the dump portion of the page file. As a result, early in the loading phase, part or all of the page file is taken out of use, which can cause system notifications about the shortage virtual memory, however, this is only a temporary phenomenon. On further loading, Winlogon determines whether the page file contains a dump by calling an undocumented API function NtQuerySystemInformation. If there is a dump, the Savedump process (\Windows\System32\Savedump.exe) is launched, which extracts the crash dump from the page file and writes it to the specified location. These operations are shown in Fig. 14-4.
Windows Error Reporting
As discussed in Chapter 3, Windows XP and Windows Server 2003 have Windows mechanism Error Reporting, which allows you to automatically transmit data about process and system failures for analysis to Microsoft (or to internal server error reports). By default this mechanism is enabled. Its operation can be influenced by changing the behavior of the Savedump process, which performs the following additional operation: when rebooting after a crash, it checks whether the system is configured to send a crash dump for analysis to Microsoft (or to a closed server). Ha fig. Figure 14-5 shows the Error Reporting dialog box, which can be accessed from the Advanced tab of the System applet in Control Panel. This dialog box allows you to configure system error reporting settings stored in the registry key HKLM\Software\Microsoft\PCHealth\ErrorReporting.
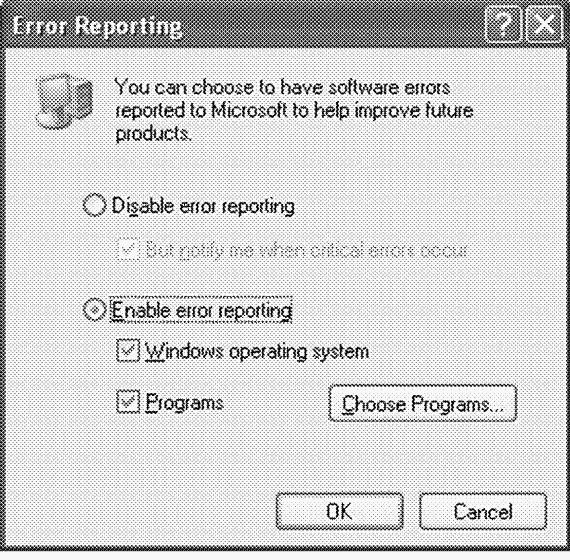
Rice. 14-5. Dialog box Error settings Reporting
After a crash-induced reboot, Savedump checks several parameters contained in the ErrorReporting section: Showui, DoReport, and IncludeKernelFaults. If all of them are true, Savedump performs the following steps to prepare the system crash report for submission to the Microsoft Online Crash Analysis (OCA) site (or to the internal crash reporting server if configured).
1. If the generated dump is not a minidump, extracts the minidump from the dump file and writes it to the default directory - \Windows\ Minidumps.
2. Writes the minidump file name to HKLM\Software\Microsoft\PCHealth\ErrorReporting\KernelFaults.
3. Adds a command to run the Dumprep utility (\Windows\System32\Dump-rep.exe) to the HKLM\Software\Microsoft\Windows\CurrentVersion\Run section so that Dumprep runs the first time the user logs on to the system.
Analysis of crash dumps via the Internet
When the Dumprep utility runs (as a result of Savedump adding a value to the registry), the utility checks the same three parameters as Savedump to determine whether the system should send an error report after a crash reboot. If it should, Dumprep generates an XML file containing basic description system, including the operating system version, a list of drivers installed on the computer, and a list of Plug and Play drivers loaded at the time of the crash. Dumprep then displays the dialog box shown in Figure. 14-6, asking the user whether to send a bug report to Microsoft. If the user has specified what is needed, and it does not contradict group policies, Dumprep sends the XML file and minidump to the site http://wat son.microsoft.com, which forwards the data to a server farm, where the reports are automatically analyzed (see the next section for more on this). Through group policies Administrators can configure their systems to send error data to an internal network directory dedicated to collecting error data. In the future, this data can be processed using using Microsoft Corporate Error Reporting (CER) Toolkit, available only to selected people Microsoft clients Software Assurance (for information, see the link http://www.microsoft.com/resources/satech/cer).
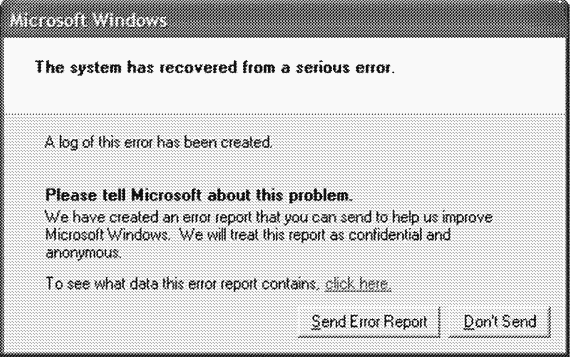
Rice. 14-6. Dialog box prompting you to submit a bug report
The automated analysis server farm uses the same mechanism as Microsoft's kernel debuggers, into which you can upload a crash dump (we'll cover them soon). During the analysis, a so-called type identifier(bucket ID) - a signature identifying a specific type of crash. The server farm queries the database, using the type ID to find a solution to the problem that caused the crash, and sends Dumprep a URL with a link to the OCA site (http://oca.microsofi.com). Dumprep launches a Web browser to open the OCA site page with the preliminary results of the dump analysis. If a solution is found, the page provides instructions on where to obtain a critical fix, service pack, or update third party driver; otherwise, it is possible to receive information about the progress of the dump analysis by email.
If your organization does not have access to the Internet or does not intend to automatically send crash dumps to Microsoft, you can use group policies to specify that error data be stored in an internal network directory; in the future they can be processed using the Microsoft CER Toolkit mentioned above.
Basic crash dump analysis
If OCA's analysis fails to find a solution to the problem, or if you are unable to submit a crash dump to the OCA site (for example, if the dump was generated by Windows 2000, which does not support OCA), you can analyze the dump yourself. As already mentioned, when you load a crash dump into Windbg or Kd, these kernel debuggers use the same analysis mechanism as OCA. Sometimes even a basic analysis is enough to identify the problem. Thus, if you are lucky, you will find a solution to the problem through automatic analysis of the crash dump. But even if you are unlucky, there are simple techniques identifying the causes of the collapse.
This section explains how to perform basic crash dump analysis, then provides recommendations on how to using Driver Verifier (which you learned in Chapter 7) intercepts the operations of incorrectly written drivers that lead to system corruption, and produces crash dumps, the analysis of which can reveal the problem.
Notmyfault
Various types The system crashes discussed here can be caused using the Notmyfault utility (wwwsysintemals.com/windowsinternals). Notmyfault consists of executable file Notmyfault.exe and Myfault.sys drivers. When you run the Notmyfault executable, it loads the driver and displays the dialog box shown in Figure 1. 14-7. In this window you can select various options crash the system or indicate that the driver should cause a memory leak from the paged memory pool. The most common (according to Microsoft Product Support Services statistics) types of system crashes are available. Once you have selected an option and clicked the Do Bug button, the executable file via the API function DeviceIoControl contacts the driver and tells it what type of error should occur. Note: it is better to experiment by causing the system to crash via Notmyfault, on test or virtual system, since it is impossible to completely eliminate the possibility that damaged memory will not be written to disk.
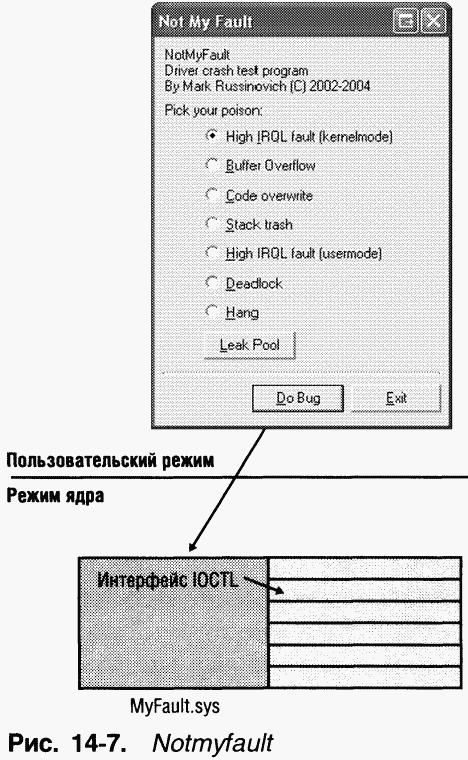
NOTE The executable and driver names are Notmyfault (“not my fault”) to reflect the fact that an application running in user mode cannot directly crash the system. The Notmyfault executable is capable of causing a system crash only by loading a driver that will perform an illegal operation in kernel mode.
Basic analysis
The easiest crash to debug is caused by selecting the High IRQL Fault (Kernelmode) switch and clicking the Do Bug button. The driver will then allocate a page in the paged memory pool, free the page, raise the IRQL level above "DPC/dispatch", and then access the freed page. (See Chapter 3 about IRQL.) If this does not crash, the system will continue to read memory past the end of the page until it crashes due to an invalid page access. Therefore, the driver performs several illegal operations.
1. Refers to memory that does not belong to him.
2. Accesses the paged memory pool at an IRQL level of “DPC/dispatch” or higher, which is unacceptable, since page faults are not allowed at such IRQLs.
3. Extends the end of the allocated memory area and attempts to access memory that could potentially be invalid. The first page access does not necessarily cause a crash as long as the page freed by the driver remains in the system working set. (For system working set, see Chapter 7.)
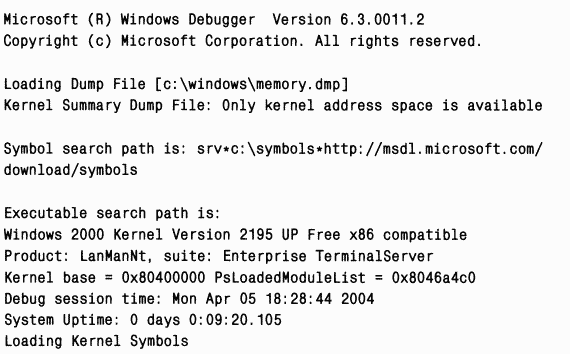
By loading the crash dump generated by such a crash into Kd, you will see the following results:
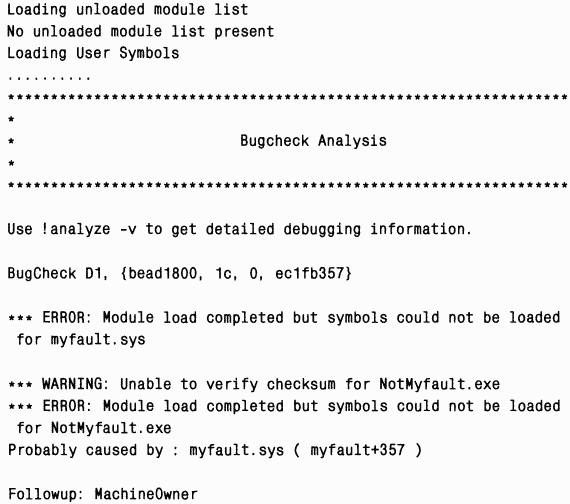
The first thing to note is that Kd reports errors when loading symbols for Myfault.sys and Notmyfault.exe. This is to be expected because the symbol files for them cannot be found in the symbol file search path (which points to the Microsoft symbol server). You will receive similar errors for third-party drivers and executable files that are not part of the operating system.
The text containing the results of the analysis is quite short: a numeric stop code and control parameters are shown, followed by the line “probably caused by”. It indicates the driver, which, from the point of view of the analysis mechanism, is the most probable cause errors. B in this case our driver was caught, and this line points directly to Myfault.sys, so there is no need to analyze it manually.
The line “Followup”, as a rule, does not carry useful information- this data is used by Microsoft when the debugger looks up the module name in the Triage.ini file contained in the Triage subdirectory of the Debugging Tools installation directory for Windows. The version of this file used internally by Microsoft lists the developers or groups that should analyze the system crash caused by a particular driver, and if a developer or group can be found, the corresponding name is displayed in the Followup line.
Detailed analysis
In all cases, even when it was possible to identify the faulty driver using a basic analysis of the Notmyfault crash dump, you need to carry out a detailed analysis with the command:
!analyze - v
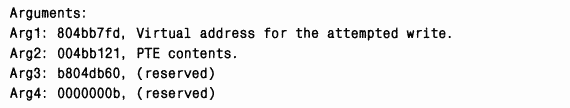
The first obvious difference between detailed analysis and default analysis is that in the first case a description of the stop code and its parameters is displayed. Below is the output of this command for the same dump:
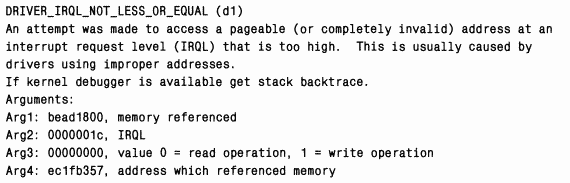
This way you won't have to open the help file to get the same information. Sometimes the output text contains recommendations for troubleshooting - you'll see an example of this in the next section, which covers in-depth analysis of dumps.
Another potentially useful piece of information that comes out of a detailed analysis is the stack trace of the thread running at the time of the crash. Here's what it looks like for the same dump:
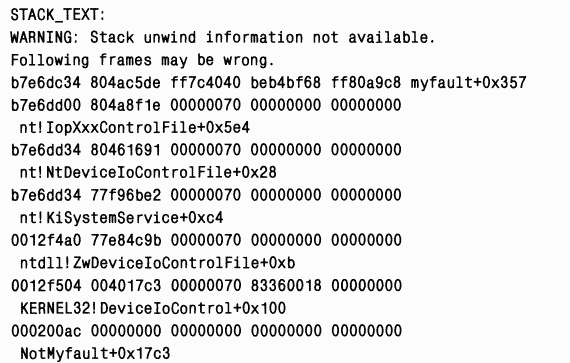
The stack above shows that the Not-myfaul executable image shown below called the function DeviceIoControl in Kernel32.dll, which in turn caused ZwDeviceIoControlFile in Ntdl.dll, etc., until the system finally crashed when executing the instruction in the Myfault image. Call stacks like this can be useful because sometimes a system crash is caused by one driver passing incorrectly formatted, corrupted, or invalid parameters to another. A driver that transmitted incorrect data that could cause a system crash can be identified during analysis by looking at the call stack, from which it can be seen that there was a call to another driver in this simple example only the myfault driver is shown in the call stack. (The "nt" module is Ntoskrnl.)
If you do not know the driver identified during analysis, run the command Im(an abbreviation for “list modules”) to view driver version information. Specify parameters k(kernel modules), v(verbose) m(match) followed by the driver name and wildcard:
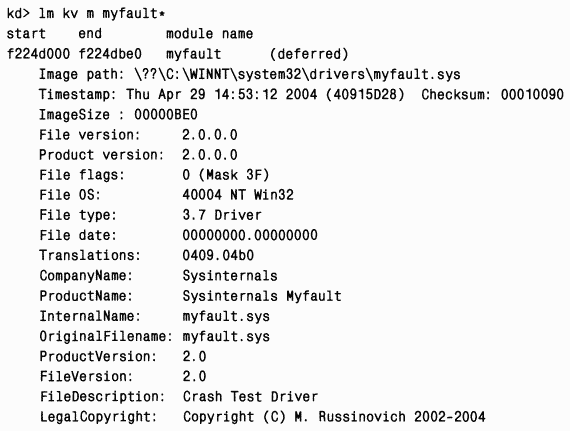
You can identify the purpose of the driver by the description, and also find out by the file and product version whether you have the most installed latest version. (This can be determined, for example, by visiting the driver developer's website.) If version information is missing, for example, the corresponding page was swapped out of physical memory at the time of the crash, you will get it from the properties of the driver image file: view them with using Windows Explorer.
Tools for analyzing crash issues
In the previous section, when we crashed the system by selecting the High IRQL Fault (Kernelmode) option in Notmyfault, automatic analysis of the dump in the debugger was easy. Unfortunately, in most cases, investigating a system crash using a debugger is difficult and often impossible. There are several levels of verification (with an increasing degree of complexity and a proportional drop in system performance), which make it possible to ensure that instead of a dump unsuitable for analysis, a dump suitable for analysis is generated. If, after configuring the system according to the requirements of one level and rebooting, you were unable to identify the cause of the crash, try switching to next level.
1. If you believe that one or more drivers may be causing the system crash because they were installed on the system relatively recently or were recently updated, or it appears from the circumstances under which the system crashes, then enable verification of these drivers in Driver Verifier and select all verification modes, except for simulating resource shortages.
2. Set the same verification level, but for everyone unsigned drivers in the system. Or, if you are running Windows 2000, where Driver Verifier does not differentiate between signed and unsigned drivers, enable verification of all non-Microsoft drivers.
3. Set the same verification level, but for all system drivers. To maintain acceptable performance, you can divide drivers into groups and activate Driver Verifier for one group of drivers between reboots.
Obviously, before spending time and effort changing the system configuration and analyzing crash dumps, it is worth making sure that the latest versions of kernel components and third-party drivers are used, and if necessary, update them through Windows Update or directly through the websites of device manufacturers.
NOTE If your system becomes unable to boot because Driver Verifier detects a driver error and causes the system to crash, boot the system in Safe Mode (in which verification is disabled), run Driver Verifier and disable verification options.
The following sections show how to use Driver Verifier to replace dumps that are unsuitable for debugging with dumps that solve the problem. Also, check out the Debugging Tools help file for tutorials on advanced debugging techniques.
Buffer overflow and special pool
There is no doubt that the most common cause of Windows crash is pool corruption. It is typically caused by a driver error that causes data to be written to the beginning or end of a buffer allocated in the paged or non-paged memory pool. The executive system's pool tracking structures are located on each side of the buffer and separate them from each other. Thus, such errors result in corrupted pool control structures, corrupted buffers of other drivers, or both. A crash caused by corrupted pools is nearly impossible to investigate using a debugger because the system crashes when the corrupted data is accessed, not when it is corrupted.
NOTE To make it easier to identify these subtle corruptions, Windows XP Service Pack 2 (or later) always performs a pool-block tail checking. Therefore, a buffer overflow will most likely immediately crash BAD_POOL_HEADER.
You can cause a buffer overflow crash by running Notmyfault and selecting the Buffer Overflow radio button. In this case, Myfault will allocate memory for the buffer and overwrite 40 bytes coming after the buffer. There may be quite a bit of time between clicking the Do Bug button and the system crashing, and you may even have to hit the pool by running some applications. This once again emphasizes that damage may not soon lead to consequences affecting the stability of the system. Analysis of the crash dump obtained from such an error almost always shows that the problem is related to Ntoskrnl or some other driver. And this demonstrates the futility of detailed analysis with such a description of the stop code:

In the stop code description, it is recommended to run Driver Verifier for each new or suspicious driver or activate a special pool using Gflags. In both cases, the goal is the same: identify potential corruption as it occurs and crash the system so that automatic analysis can detect the driver that caused the corruption.
When Driver Verifier's custom pool mode is enabled, the drivers being verified use the custom pool instead of the paged or nonpaged memory pool in all cases where memory is allocated for buffers of size slightly smaller size pages. The buffer, for which memory is allocated from a special pool, is sandwiched between two invalid pages and, by default, is aligned to the top edge of the page. In addition, special pool management routines fill unused space on the page containing the buffer in a random pattern. Ha fig. Figure 14-8 shows how memory is allocated from a special pool.

The system detects any buffer overflows contained in a page because they result in a page fault: an invalid page that follows the buffer is accessed. The signature is needed to intercept going beyond the end of the buffer at the moment when the driver frees the buffer: when going beyond the end, the integrity of the template placed in this area when allocating memory for the buffer will be violated.
To see how to use a special pool to cause a system crash that can be easily diagnosed using an automatic analysis engine, run DriverVerifier Manager. In Windows 2000, go to the Settings tab, enter myfault.sys in the text field at the bottom of the page intended for the task additional drivers, select the special pool checkbox, save your changes, exit Driver Verifier Manager, and reboot. On Windows XP and Windows Server 2003, select Create Custom Settings ( For Code Developers) [Create not standard parameters(for program code)] on the first page of the wizard, on the second - Select Individual Settings From A Full List, on the third - Special Pool. Next, select Select Drivers From A List, and on the page that lists driver types, enter myfault.sys in the dialog box that opens after clicking the add unloaded drivers button. (Don't look for the myfault.sys file in this dialog box—just enter its name.) Then check the myfault.sys driver, exit the wizard, and reboot.
When you run Notmyfault and cause a buffer overflow, the system will immediately crash, and analyzing the dump will give the following result:
Probably caused by: myfault.sys (myfault+3f1)
Upon detailed analysis, you will receive the following description of the stop code:

Thanks to the special pool, the elusive bug immediately showed itself, making analysis trivial.
Code rewriting and protection system code from recording
A driver that has its own data structures corrupted or misinterpreted due to a “bug” may access memory that does not belong to it, treating the corrupted data as a pointer to a memory area. Such an invalid pointer could point to anything in the address space, including data belonging to other drivers, invalid memory pages, or code from other drivers or the kernel. As with a buffer overflow, the driver that caused the data corruption is usually not identified once the corruption is detected and the system crashes. Using a special pool increases the likelihood of identifying “bugs” associated with incorrect pointers, but does not detect code corruption.
If you run Notmyfault and select the Code Overwrite radio button, the Myfault driver will corrupt the function's entry point NtReadFile. Next, there are two possible options. If your system is running Windows 2000 and has no more than 127 MB of physical memory, or is running Windows XP or Windows Server 2003 and has no more than 255 MB of physical memory, it will crash and dump analysis will point to Myfault.sys.
The description of the stop code displayed during detailed analysis states that the Myfault driver attempted to write data to read-only memory:
ATTEMPTED_WRITE_TO_READONLY_MEMORY (be)
An attempt was made to write to readonly memory. The guilty driver is on the stack trace (and is typically the current instruction pointer). When possible, the guilty driver"s name (Unicode string) is printed on the bugcheck screen and saved in KiBugCheckDriver.
However, if you have Windows 2000 and more than 127 MB of memory, or Windows XP or Windows Server 2003 and more than 255 MB of memory, a different type of crash will occur because the memory corruption will not be immediately apparent. Because NtReadFile is a widely used system function that is Windows system is addressed when reading keyboard or mouse input, the system will crash almost immediately as soon as any thread attempts to execute the corrupted code. An error will occur due to an invalid instruction being executed. Analysis of the crash dump performed in this case may produce different results, but they will certainly be incorrect. Typically, the analysis engine concludes that the most likely sources of the error are Windows.sys or Ntoskrnl.exe. In case of such a crash, the following description of the stop code is displayed:
Different configurations behave differently due to the fact that Windows 2000 introduced a mechanism write protection of system code(system code write protection). Table 14-2 shows which configurations do not use system code write protection by default.

If system code write protection is enabled, the memory manager projects Ntoskrnl.exe, HAL, and boot drivers as standard physical pages (4 KB for x86 and x64, 8 KB for IA64). Because when projecting images, detail is provided with precision down to size standard page, the memory manager can protect pages containing code from being written and generate an access error when trying to modify them (which is what you saw in the first crash). However, when system code write protection is disabled, the memory manager uses large pages when projecting Ntoskrnl.exe (4 MB for x86 or 16 MB for IA64 and x64). This default mode operates in Windows 2000 when there is more than 127 MB of memory, and in Windows XP or Windows Server 2003 when there is more than 255 MB of memory. The memory manager cannot protect the code because the code and data may be on the same page.
If system code write protection is disabled and crash dump analysis reports unlikely reasons crash or if you suspect code corruption has occurred, you should enable protection. To do this, the easiest way is to enable verification of at least one driver using Driver Verifier. You can also enable protection manually by adding two parameters to the registry key HKLM\System\CurrentControlSet\Control\ Session Manager\Memory Management. First, specify the maximum possible value for the amount of memory, from which the memory manager uses large pages instead of standard pages when projecting Ntoskrnl.exe. Create a LargePageMinimum parameter of type DWORD and give it the value 0xFFFFFFFF. Add another DWORD parameter, Enforce-WriteProtection, and set it to 1. Reboot your computer for the changes to take effect.
NOTE When a debugger has access to image files included in a crash dump, internal analysis runs the debugger!chkimg command to check whether the copy of the image in the crash dump matches the image on disk and reports the differences. Note that if you enable Driver Verifier, chkimg will definitely detect differences when compared with the Ntoskrnl.exe file.
In-Depth Analysis of Crash Dumps
The previous section talked about how to use Driver Verifier to obtain crash dumps, the automatic analysis of which can solve the problem. However, there may be cases where it is not possible to get the system to generate a dump that is easy to analyze. In such cases, manual analysis is needed to try to determine what the problem is.
Using the debugger command !process 0 0 look at what processes are running and make sure you understand the purpose of each one. Try shutting down or uninstalling apps and services that you can do without.
Using the command Im with parameter kv List the loaded kernel mode drivers. Make sure you understand the purpose of each third-party driver and that you are using the latest versions.
Using the command !vm Check to see if the system's virtual memory, paged memory pool, and nonpaged memory pool are exhausted. If virtual memory is exhausted, the number of pages transferred will be close to the limit. In this case, try to identify a potential memory leak: look through the list of processes and select those that have a lot of memory transferred. If the paged or nonpaged memory pool is exhausted (i.e., the amount used memory is close to the maximum), see the experiment “Analyzing Memory Leaks in a Pool” in Chapter 7.
There are other debugging commands that can be useful, but they require more advanced knowledge. One such command is /irp. The next section shows how to use it to identify suspicious drivers.
Stack clogged
Stack overflow or stack trashing is caused by errors associated with going beyond the end or beginning of a buffer. However, in such cases, the buffer is not in the pool, but on the stack of the thread executing the erroneous code. Errors of this type are also difficult to debug because the stack plays an important role in any crash dump analysis.
When you run Notmyfault and select Stack Trash, the Myfault driver overflows the buffer allocated on the stack of the thread where the driver code is running. Myfault attempts to return control to the Ntoskrnl function that called it and reads the return address from the stack from which execution should continue. However, this address is corrupted by a stack buffer overflow, so the thread continues execution from some other address, perhaps one that does not even contain code. When a thread attempts to execute an invalid processor instruction or accesses an invalid memory location, an exception will be thrown and the system will crash.
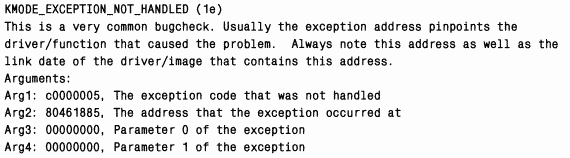
In different crash cases, stack overflow crash dump analysis will point to different drivers, but the stop code will always be the same - KMODE_EXCEPTION_NOT_HANDLED. If you do verbose analysis, the stack trace information will look like this:
STACK_TEXT:
b7bOebd4 00000000 00000000 00000000 00000000 0x0
This is because we are overwriting the stack with zeros. Unfortunately, mechanisms such as a special pool and write protection of system code do not allow identifying “bugs” of this type. You will have to perform the analysis manually, using indirect evidence to determine which driver was running at the time the stack was damaged. One of possible options- examine the IRP packets that the thread running at the time the stack is clogged is working with. When a thread issues an I/O request, the I/O manager writes a pointer to the corresponding IRP to the Irp list stored in the thread's ETHREAD structure. Debugger command /thread Dumps this list for the given thread. (If the address of the stream object is not specified, the command !thread dumps the current thread running on the processor.) The IRP can then be examined using the command !irp\
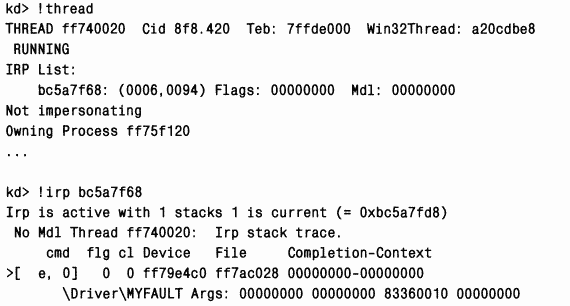
The output shows that the current and only stack fragment for the IRP (indicated by the prefix "›") belongs to the Myfault driver. If this were in practice, the next step would be to ensure that the latest driver is installed, and, if not, install new version. If this does not help, you would need to activate Driver Verifier to of this driver(enabling all modes except simulating low memory).
System freezing or unresponsive
If the system stops responding (that is, it does not respond to keyboard or mouse input, the mouse cursor does not move, or you can move the cursor but the system does not respond to clicks), the system is said to stuck. There are several possible reasons for a system freeze:
When accessing the device driver, the ISR (interrupt service routine) or DPC did not return control;
The high priority thread (running in real time) has preempted the input threads into the windowing system;
A deadlock occurred while executing code in kernel mode (two threads or processors are holding resources, needed friend friend, and neither of them releases their resource).
If you're running Windows XP or Windows Server 2003, you can detect deadlocks using one of Driver Verifier's deadlock detection features. Deadlock detection looks at spin locks, fast mutexes, and regular mutexes to identify patterns that may lead to deadlocks. (See Chapter 3 for information about these and other synchronization primitives.) If such a situation is detected, Driver Verifier crashes the system by indicating which driver is causing the deadlock. Simplest form mutual locking - each of two threads holds a certain resource needed by the other thread, while neither of them releases its resource and waits for the release of the other resource. If you are using Windows XP or Windows Server 2003, the first thing to do to resolve system hangs is to enable deadlock detection for suspicious drivers, then for unsigned drivers, and then for all drivers. You should work in this mode until the system crashes, which will allow you to identify the driver causing the deadlock.
If you are using Windows 2000, or if you have checked all drivers and the system continues to freeze, you must either manually crash the frozen system and analyze the resulting dump, or examine the system using a kernel debugger.
So, there are two approaches to investigating a hanging system, allowing you to identify the driver or component that is causing the freezing. The first is to crash the frozen system and hope that a dump will be obtained that can be analyzed. The second is to examine the system using a kernel debugger and analyze the operation of the system. With both approaches, it is necessary pre-setting and reboot. To identify and resolve the cause of the hang, the same system scan is performed in both cases.
To manually crash a frozen system, first add the HKLM\System\CurrentControlSet\Services\i8042prt\Parameters\ CrashOnCtrlScroll DWORD value to the registry with a value of 1. After rebooting, the i8042 port driver, which is the PS/2 keyboard input port driver, will watch keystrokes in its ISR (ISRs are covered in detail in Chapter 3) and track double keystrokes Scroll keys Lock when pressed right Ctrl key. Having detected such a sequence of presses, the driver calls the function KeBugCheckEx with stop code MANUALLY_INITIATED_CRASH (0xE2), indicating that the crash was manually initiated by the user. When the system reboots, open the crash dump and, using the techniques described above, try to determine why the system crashed (for example, determine what thread was running when the system crashed, try to understand what happened by analyzing the kernel stack, etc.). Note that this approach works in most hanged systems, but fails when the i8042 port driver ISR fails. (This ISR does not execute if all processors are hung because their IRQL is higher than the ISR's IRQL, or if corruption of system data structures has affected code or data used in interrupt handling.)
NOTE Manually crashing a frozen system based on i8042 port driver functionality is not possible when using USB keyboards. This approach only works for PS/2 keyboards.
Another way to manually crash the system is to use the built-in crash button. (It is available on some servers of the " high end".) Then, to initiate a collapse, motherboard system generates an NMI (non-maskable interrupt). To enable this feature, set the registry DWORD value HKLM\System\CurrentControlSet\Control\CrashControl\NMICrashDump to 1. In this case, when you press the “crash” button, an NMI will be generated in the system, and the kernel NMI interrupt handler will call KeBugCbeckEx. This approach is more universal than using the i8042 port driver, since the IRQL of the NMI is always higher than that of the i8042 port driver interrupt. For more information, see the link http://www.microsoft.com/platform/proc/dmpsw.asp.
If you can't manually generate a crash dump, try investigating the frozen system. First of all, boot the system into debug mode. This can be done in two ways. Press F8 during boot and select Debugging Mode, or add a boot in debugging mode entry to the Boot.ini file: copy the entry that is already in the system's Boot.ini file and add the /DEBUG switch. When you press F8, the system will use the default connection ( serial port COM2 and speed 19200 baud). When using /DEBUG mode, you will need to configure the connection mechanism between the host system running the kernel debugger and the target system booting in debug mode, and set the /Debugport and /Baudrate switches to match the connection type. Two connection types are available: null modem cable, connecting the serial ports, or (on Windows XP and Windows Server 2003 systems) an IEEE 1394 (Firewire) cable connected to port 1394 on each system. For details on setting up the host system and target system for kernel debugging, see the reference Windows file Debugging Tools.
When booting into debug mode, the system loads the kernel debugger and prepares it to connect to a kernel debugger running on another computer connected via a null modem cable or IEEE 1394. Note that the presence of the kernel debugger does not affect performance. When the system hangs, run the Windbg or Kd debugger on the connected system, establish a connection between the kernel debuggers, and debug the code of the frozen system. This approach will not work if interrupts are disabled or if the kernel debugger code is corrupt.
NOTE Booting a system into debug mode does not affect performance unless that system is connected to another. However, the same cannot be said for a system configured to automatically reboot after a crash: if kernel debugging is enabled when the system boots, then after the system crashes the kernel debugger will wait for a connection to another system.
When performing analysis, you do not have to leave the system in a stopped state, but use the debugger command .dump Create a crash dump file on the debug host computer. Then reboot the frozen system and analyze the crash dump offline (or send it to Microsoft). Note: this can take a long time if you are using a null modem cable (compared to the faster 1394 connection), so you can only get a minidump with the command .dump /t. If the target computer is capable of writing a crash dump, you can force it to do so by entering the command in the debugger .crash. Then the target computer will create a dump on its local hard drive, and you can view the dump after the system reboots.
The hang can be caused by running Notmyfault and selecting the Hang option. The Myfault driver will then queue the DPC doing endless loop for each processor in the system. Because the processor's IRQL is at "DPC/dispatch" when executing DPC functions, the keyboard ISR will respond to a sequence of keystrokes that causes a crash.
When you start debugging a frozen system or load into the debugger a dump that you manually generated for a frozen system, you should run the command !analyze with parameter - hang. The debugger will then analyze the system locks and try to determine whether a deadlock has occurred and, if so, which driver or drivers are involved. However, if the hang is similar to that caused by the Notmyfault program, the command !analyze won't tell you anything useful.
If the team !analyze did not help solve the problem, run the commands !thread And !process in each of the processor contexts for the dump. (To switch between processor contexts, use the ~ command, for example ~1 switches to the processor context 1.) If the thread that caused the system to hang is executing an infinite loop at the "DPC/dispatch" IRQL level or higher, you will see the driver module in which this is happening in the stack trace information output by the command !thread. If the system hang is caused by the Notmyfault program, the stack trace information obtained from the system crash dump looks like this:

The first few lines of stack trace information refer to the routines called when you pressed the keys that the i8042 port driver causes the system to crash. The presence of the Myfault driver means that the system freeze could be caused by it.
Another command that may be useful is !locks; it displays the status of all executive system resource locks. By default the command only shows controversial resources, i.e. resources for which at least two threads claim ownership. Explore the stacks of threads owning such resources using the command !thread, and see which driver they might belong to.
If there is no crash dump
In this section, we'll look at how to troubleshoot systems that for some reason do not record a crash dump. A crash dump may not be written because the page file size on the boot volume is too small to accommodate the dump, or because there is not enough disk space to retrieve the dump after a reboot. These two reasons can easily be eliminated by increasing the page file size or specifying during configuration that the dump is saved on a volume where there is enough space.
A third reason why a crash dump is not written could be that the kernel code and data structures required to write the crash dump are corrupted during the crash. As already mentioned, a checksum is calculated for this data, and if a checksum mismatch is detected during a crash, the system does not even try to save a crash dump (so as not to risk the data on the disk). Therefore, in this case, you need to monitor the moment of system crash and try to determine the cause of the crash.
Finally, another reason is that disk subsystem cannot handle disk write requests (a situation that itself can cause the system to crash). This situation occurs if hardware failure disk controller or cable is damaged hard drive.
One of simple solutions- Disable the Automatically Restart option in the Startup And Recovery options so that you can investigate the blue screen from the console. However, the text of the “blue screen” allows us to identify the reasons for the system crash only in the most simple cases.
For a deeper analysis, you need to use a kernel debugger to examine the behavior of the system at the time of the crash. To do this, boot the system in debug mode, which was discussed in the previous section. When a system booted in debug mode crashes, it does not blue screen or attempt to write a dump, but waits for a connection to the kernel debugger running on the host system. Therefore, you can see what caused the crash, and it's likely that you can do some basic analysis using the kernel debugger commands described earlier. As discussed in the previous section, the debugger command allows you to save a copy of the crashed system's memory for later debugging, allowing you to reboot the system and debug offline.
EXPERIMENT: Blue Screen Screen Saver
A great way to remember what a blue screen looks like or to make fun of your friends and colleagues is to run screen saver Sysinternals Blue Screen, which can be downloaded from the website wwwsysinter nah.com. It accurately simulates a blue screen for the version of Windows you're running and displays system information (such as a list of loaded drivers) that matches reality. In addition, it simulates an automatic reboot by showing the screen Windows startup. Note: Unlike other screen savers that disappear when you move the mouse, Blue Screen requires you to press a key.
Using the Psexec utility from the Sysinternals website, you can even run a screen saver on another system by running the command:
psexec \\computername - i - d "c: \sysinternals bluescreen.scr" - s
To do this, you must have administrative privileges on the remote system. (Using keys - And And - p You can use the Psexec utility to set other security identities.) Check if your colleagues have a sense of humor!
Today we will talk about what a memory dump is. This file contains certain data that was in RAM some specific computer V certain period time. It is also valuable for specialists and developers of various software. When a crash memory dump occurs, these people have the opportunity to see at what point it happened and for what reasons. This allows you to correct software defects and bugs. Whenever Microsoft operating systems fail, a memory dump is always created.
If you need to find the location as well as the size this file, you must click right click mouse on the computer icon. When it comes out, launch its properties and open the tab with additional information. Then in the boot and recovery section you need to click on the settings button. A window for recording debugging information will appear in front of you. From the drop-down list, you have the opportunity to select one of the following functions.
A small memory dump will be equal to sixty-four kilobytes. In this case, only the most necessary information about the problems that have arisen will be recorded in it. Next comes the kernel memory dump. Its size is also usually sixty-four kilobytes. It contains debug data for your system kernel. Let's move on to the last point. It's called "full dump" Windows memory 7". The entire system memory is completely saved into it. At this moment, necessary files, the size of which is equivalent to the RAM that is installed on your device.

You can also independently designate the location where this file will be located, and also change the setting responsible for shallow recording in existing file. I strongly recommend that you do not change these settings so that they remain as they were by default.
It is also worth noting that you can create this file yourself manually. To do this call start menu, start the service called “Run” and enter the command “regedit” in it, then click the “Ok” button. The operating system will appear in front of you. There you need to find a key that looks like this: HKEYS LOCAL MACHINES/ SYSTEMA/ CurrentControlSets / Service/ i8042prt/ Parametres.

When you find it, right-click your mouse on the right side of this window and select Create DWORLD. After this, write the name of the key “CrashOnCtrlScroll”, and then assign it the value “1”. Then close this editor and restart your computer or laptop. In order to be created new file containing a memory dump, press and hold the Contral button, then press the key twice
This is all. I hope the above information has been presented in an accessible manner. But without certain reasons it is not necessary to carry out these procedures, since this system resources. If you make mistakes, irreparable consequences may occur for your operating system.
One of the most common failures Windows operation- system exceptions that the user sees as a “blue screen of death” (BSOD). As a rule, this fatal error occurs either due to a malfunction of drivers, hardware (usually when loading the OS) or due to the action of viruses and antiviruses.
The blue screen of death contains information about the reasons that caused the exception (in the form of a STOP error code of the form 0x0000007b), memory addresses that were accessed when an exception occurred, and other useful information. This information is called a STOP error, variable parameters which are just memory addresses. Sometimes it also contains the name of the file that caused the exception.
All this information is not displayed on the screen for long (up to 100 seconds), after which the computer reboots. During this short time, as a rule, a memory dump is generated and written to a file. One of the important professional ways fault diagnosis - memory dump analysis, which will be discussed in detail in this article.
What is a dump
- dump (English) – garbage heap; dump; hole; slum.
- dump (memory dump) – 1) dump, outputting the contents of RAM to print or screen; 2) a “snapshot” of RAM; data obtained as a result of dumping; 3) emergency removal, shutdown, reset.
- dumping – dumping, dump removal.
Settings for saving a memory dump are stored in the Windows system registry.
Information about the memory dump in the system Registry:
In the section Windows Registry A crash dump is defined by the following parameters:
– REG_DWORD parameter AutoReboot with the value 0×1 (option Automatically reboot the auxiliary window Boot and Restore of the System Properties dialog box);
– REG_DWORD parameter CrashDumpEnabled with a value of 0×0, if a memory dump is not created; 0×1 – Complete memory dump; 0×2 – Kernel memory dump; 0x3 – Small memory dump (64KB);
– REG_EXPAND_SZ DumpFile parameter with the default value %SystemRoot%\MEMORY.DMP (dump file storage location);
– REG_DWORD-parameter LogEvent with a default value of 0×1 (option Log event to syslog Windows Boot and Recovery);
– REG_EXPAND_SZ MinidumpDir parameter with the default value %SystemRoot%\Minidump (Small dump folder option of the Boot and Recovery window);
– REG_DWORD parameter Overwrite with a default value of 0×1 (option Overwrite existing dump file of the Boot and Restore window);
– REG_DWORD parameter SendAlert with a default value of 0x1 (option Send administrative alert of the Boot and Recovery window).
How the system creates a crash dump file
While loading operating system checks the crash dump settings in the registry key. If at least one parameter is specified, the system generates a map of disk blocks occupied by the paging file on the boot volume and stores it in memory. The system also determines which disk device driver controls the boot volume, calculates checksums for the driver's memory image, and for data structures that must be integer for the driver to perform I/O operations.
After a failure, the system kernel checks the integrity of the page file map, disk driver, and disk driver control structures. If the integrity of these structures is not violated, then the system core calls special functions I/O disk driver, designed to save a memory image after a system failure. These I/O functions are self-contained and do not rely on kernel services because the programs responsible for writing the crash dump cannot make any assumptions about which parts of the system kernel or device drivers were damaged when a crash occurred. The system kernel writes data from memory to the paging file sector map (it does not have to use file system drivers).
First, the system kernel checks the status of each component involved in the dump process. This is done so that when writing directly to disk sectors, it does not damage data located outside the page file. The page file size must be 1MB larger size physical memory, because when information is written to a dump, a header is created that contains the crash dump signature and the values of several important system kernel variables. The header is less than 1MB, but the operating system can increase (or decrease) the size of the page file by at least 1MB.
After booting the system Session Manager Windows session NT; disk address – \WINDOWS\system32\smss.exe) initializes the system page files, using to create each file own function NtCreatePagingFile. NtCreatePagingFile determines whether the page file being initialized exists and, if so, whether it has a dump header. If there is a header, then NtCreatePagingFile sends it to the Session Manager special code. Session Manager then starts the Winlogon process (Windows NT Logon Program; disk address is \WINDOWS\system32\winlogon.exe), which is notified of the existence of a crash dump. Winlogon runs the SaveDump program (Windows NT Memory Copy Program; disk address - \WINDOWS\system32\savedump.exe), which parses the dump header and determines further actions in an emergency.
If the header indicates the existence of a dump, then SaveDump copies the data from the page file to the crash dump file, the name of which is specified by the REG_EXPAND_SZ parameter of the DumpFile section of the Registry. While SaveDump rewrites the dump file, the operating system does not use the part of the page file that contains the crash dump. During this time, the amount of virtual memory available to the system and applications is reduced by the size of the dump (and messages may appear on the screen indicating that virtual memory is low). SaveDump then informs the memory manager that the dump has completed saving, and it releases the part of the page file in which the dump is stored for general use.
After saving the dump file, the SaveDump program records the creation of a crash dump in the System event log, for example: “The computer was rebooted after a critical error: 0x100000d1 (0xc84d90a6, 0x00000010, 0x00000000, 0xc84d90a6). Memory copy saved: C:\WINDOWS\Minidump\Mini060309-01.dmp".
If the Send administrative alert option is enabled, SaveDump sends an alert to the administrator.
Types of dumps
- Full memory dump writes the entire contents of system memory when a fatal error occurs. For this option, you must have a paging file on the boot volume, the size of which is equal to the amount of all physical RAM plus 1MB. By default, a complete memory dump is written to the %SystemRoot%\Memory.dmp file. Whenever new error and creating a new full memory dump file (or kernel memory dump) previous file is replaced (overwritten). The Full memory dump option is not available on PCs that have a 32-bit operating system and 2 gigabytes or more of RAM.
When a new error occurs and a new full memory dump file is created, the previous file is replaced.
- Kernel memory dump writes only kernel memory, making the process of writing data to the log when the system suddenly stops proceeds faster. Depending on the amount of physical memory of the PC, in this case the paging file requires from 50 to 800MB or one third of the physical memory of the computer on the boot volume. By default, the kernel memory dump is written to the %SystemRoot%\Memory.dmp file.
This dump does not include unallocated memory or memory allocated to user-mode programs. It includes only memory allocated to the kernel and hardware-dependent layer (HAL) in Windows 2000 and later versions of the system, as well as memory allocated to kernel-mode drivers and other kernel-mode programs. In most cases, such a dump is the most preferable option. It takes up much less space than a full memory dump, while excluding only those memory sectors that are most likely not related to the error.
When a new error occurs and a new kernel memory dump file is created, the previous file is replaced.
- Small memory dump records the smallest amount of useful information necessary to determine the cause of the problem. To create a small memory dump, the page file size must be at least 2MB on the boot volume.
Small memory dump files contain the following information:
- Fatal error message, its parameters and other data;
- list of loaded drivers;
- the processor context (PRCB) on which the failure occurred;
- process information and kernel context (EPROCESS) for the process that caused the error;
- process information and kernel context (ETHREAD) for the thread that caused the error;
- The kernel-mode call stack for the thread that caused the error.
The small memory dump file is used under limited hard space disk. However, due to the limited information it contains, analysis of this file may not always detect errors that were not directly caused by the thread that was running when the error occurred.
Whenever next error and creating a second small memory dump file, the previous file is retained. To everyone additional file given unique name. The date is encoded in the file name. For example, Mini051509-01.dmp is the first memory dump file created on May 15, 2009. A list of all small memory dump files is stored in the folder %SystemRoot%\Minidump.
The Windows XP operating system is undoubtedly much more reliable previous versions, – thanks to the efforts of both Microsoft developers and driver developers hardware, and application software developers. However, emergency situations - all kinds of failures and system crashes - are inevitable, and whether the PC user has the knowledge and skills to eliminate them depends on whether he will have to spend a few minutes troubleshooting and troubleshooting (for example, updating/debugging a driver or reinstalling application program, causing system failure), – or several hours to reinstall/configure the operating system and application software (which does not guarantee the absence of failures and crashes in the future!).
Many system administrators still neglect the analysis of Windows crash dumps, believing that working with them is too difficult. It’s difficult, but it’s possible: even if, for example, the analysis of one dump out of ten turns out to be successful, the efforts spent on mastering the simplest techniques for analyzing crash dumps will not be in vain!..
I will give examples from my “sysadmin” practice.
IN local network without apparent reason(“hardware” is in order, the absence of viruses is guaranteed, users have “normal hands”) several workstations with Windows XP SP1/SP2 “on board” were killed. It was not possible to boot the computers in normal mode - it got to "Greetings" - and it took forever to reboot. At the same time, the PCs booted into Safe Mode.
The study of memory dumps made it possible to identify the cause of the malfunction: the culprit turned out to be Kaspersky antivirus, or rather, fresh ones antivirus databases(more precisely, two database modules – base372c.avc, base032c.avc).
...There was another such case. On a local PC running Windows XP SP3, a reboot occurred when trying to open video files in .avi and .mpeg formats. Studying the memory dump allowed us to identify the cause of the problem - the nv4_disp.dll driver file NVIDIA video cards GeForce 6600. After updating the driver, the problem was resolved. In general, the nv4_disp.dll driver is one of the most unstable drivers, which often led to BSOD.
In both of these cases, studying the crash memory dump made it possible to reduce the time for diagnosing and eliminating the malfunction to a minimum (several minutes!).
Memory dump analysis
There are many programs for analyzing crash memory dumps, for example, DumpChk, Kanalyze, WinDbg.
Let's look at analyzing crash memory dumps using the WinDbg program (part of Debugging Tools for Windows).
Installing Debugging Tools
- visit Microsoft Corporation's Web site http://www.microsoft.com/whdc/devtools/debugging/default.mspx;
- download Debugging Tools for Windows, for example, for a 32-bit version of Windows this can be done on the Download the Debugging Tools for Windows page;
- after downloading, run installation file;
- in the Debugging Tools for window Windows Setup Wizard click Next;
- in the window with license agreement set the switch I agree –> Next;
- in the next window, select the installation type (by default, debugging tools are installed in the \Program Files\Debugging Tools for Windows folder) –> Next –> Install –> Finish;
- To interpret memory dump files, you must also download the Symbol Packages for your version of Windows - go to the Download Windows Symbol Packages page;
- select your version of Windows, download and run the Symbol Packages installation file;
- in the window with the license agreement, click Yes;
- in the next window, select the installation folder (the default is \WINDOWS\Symbols) –> OK –> Yes;
- V Microsoft window Windows Symbols with the message “Installation is complete” click OK.
Using WinDbg to Analyze Crash Dumps
- run WinDbg (installed in the \Program Files\Debugging Tools for Windows folder by default);
- select menu File –> Symbol File Path…;
- in the Symbol Search Path window, click the Browse... button;
- in the Browse Folder window, specify the location of the Symbols folder (by default – \WINDOWS\Symbols) –> OK –> OK;
- select menu File –> Open Crash Dump... (or press Ctrl + D);
- in the Open Crash Dump window, specify the location of the Crash Dump File (*.dmp) –> Open;
- in the Workspace window with the question “Save information for workspace?”, check the Don’t ask again –> No box;
- The Command Dump window will open in the WinDbg window<путь_и_имя_файла_дампа>with dump analysis;
- review the memory dump analysis;
- in the “Bugcheck Analysis” section will be indicated possible reason crash, for example, “Probably caused by: smwdm.sys (smwdm+454d5)”;
- to view detailed information click the “!analyze -v” link in the “Use !analyze -v to get detailed debugging information” line;
- close WinDbg;
- Use the information obtained to eliminate the cause of the problem.
For example, in the following screenshot the cause of the malfunction is the nv4_disp.dll file of the video card driver.
There are a great many problems in connection with which “blue screens of death” may appear. In most cases, these are, of course, problems related to device drivers and hardware malfunctions. The question arises: how can an ordinary user determine what is wrong?
It’s worth starting by setting up the operating system, namely, making sure that it does not automatically reboot when a blue screen error occurs, but shows this screen until manual reset or shutdown by the user:
- To do this, open “System Properties”, find the item “ Additional options systems."
- Find the “Download and Recovery” section in the window that opens. Click Options.
- Then, in the new window, find the “System Failure” section. Uncheck the “Perform automatic reboot” checkbox.
- You will then need to save the changed parameters by clicking the “OK” button.
Now, if a crash occurs accompanied by a blue screen of death, the computer will not restart and you will be able to write down the error code, which will help you identify the problem in the future. For example, finding an error in a table BSOD errors Determine that the problem is related to the RAM. If performing such manipulations is difficult for you, in this case there is a utility that will show a blue screen in a convenient format for the average user.
Utility to help!
Blue Screen View will independently find crash memory dump files created during a failure, where data about critical error. Blue Screen View has a two-pane interface. IN top panel The utility presents a list of dump files, and in the bottom panel - the files that caused the failure with addresses.
- dump(memory dump) - a “snapshot” of RAM, outputting the contents of RAM to print or screen;
There are the following types of dumps:
- Full memory dump writes the entire contents of system memory when a fatal error occurs. By default, a complete memory dump is written to a file Windows Directory\Memory.dmp. The Full memory dump option is not available on PCs that have a 32-bit operating system and 2 gigabytes or more of RAM. When a new error occurs, the previous file is replaced.
- Kernel memory dump writes only kernel memory, making the process of writing data to the log when the system suddenly stops proceeds faster. By default, the kernel memory dump is written to the file Windows\Memory.dmp. When a new error occurs and a new kernel memory dump file is created, the previous file is also replaced.
- Small memory dump writes the smallest volume necessary information to determine the cause of the problem. Small memory dump files contain information about the fatal error, its parameters, a list of loaded drivers, and so on.
Note! When the next error occurs, the previous file is saved. Each additional file is given a unique name based on its creation date. For example, Mini112711−01.dmp is the first memory dump file created on November 27, 2011. A list of all small memory dump files is stored in the Windows Directory\Minidump folder.
Getting a Memory Dump
- Open system properties Win + Pause (or right-click on “My Computer” and properties);
- Advanced system settings, Advanced tab, Startup and Recovery, and Options.
- In the window that appears "Load and restore" select the generation of small dumps: - Record debugging information, Small memory dump.
The checkbox is immediately unchecked automatic reboot, as already mentioned above.
Result of BlueScreenView
BlueScreenView will scan all crash dump files created during BsoD and display information about all crashes in one table. For each crash, BlueScreenView displays a file dump, the date and time of the crash, basic crash information that appears on the blue screen, and details of the drivers or modules that may have caused the crash (file name, product name, file description, and file version).
All Windows systems, when a fatal error is detected, make a crash dump (snapshot) of the contents of RAM and save it on hard drive. There are three types of memory dump:
Full memory dump – saves the entire contents of RAM. The image size is equal to the size of RAM + 1 MB (header). Very rarely used, as on systems with large amounts of memory the dump size will be too large.
Kernel memory dump – saves RAM information related to kernel mode only. User mode information is not saved because it does not contain information about the cause of the system crash. The size of the dump file depends on the size of the RAM and varies from 50 MB (for systems with 128 MB of RAM) to 800 MB (for systems with 8 GB of RAM).
Small memory dump (mini dump) - contains a fairly small amount of information: an error code with parameters, a list of drivers loaded into RAM at the time of the system crash, etc., but this information is enough to identify the faulty driver. Another advantage of this type of dump is small size file.
System setup
To identify the driver that caused it, it will be enough for us to use a small memory dump. In order for the system to save a mini dump during a crash, you must perform the following steps:
| For Windows Xp | For Windows 7 |
|
|
Having completed all the manipulations, after each BSoD a file with the extension .dmp will be saved in the C:\WINDOWS\Minidump folder. I advise you to read the material "". You can also check the box “ Replace existing dump file" In this case, each new crash dump will be written over the old one. I do not recommend enabling this option.
Analyzing a crash dump using BlueScreenView
So, after the Blue Screen of Death appeared, the system saved a new crash memory dump. To analyze the dump, I recommend using the BlueScreenView program. It can be downloaded for free. The program is quite convenient and has an intuitive interface. After installing it, the first thing you need to do is specify the location for storing memory dumps on the system. To do this, go to the menu item “ Options” and select “ AdvancedOptions" Select the radio button “ LoadfromthefollowingMini Dumpfolder” and specify the folder in which the dumps are stored. If the files are stored in the C:\WINDOWS\Minidump folder, you can click the “ Default" Click OK and get to the program interface.

The program consists of three main blocks:
- Main menu block and control panel;
- Crash dump list block;
- Depending on the selected parameters, it may contain:
- a list of all drivers in RAM before the blue screen appears (by default);
- a list of drivers located in the RAM stack;
- BSoD screenshot;
- and other values that we will not use.
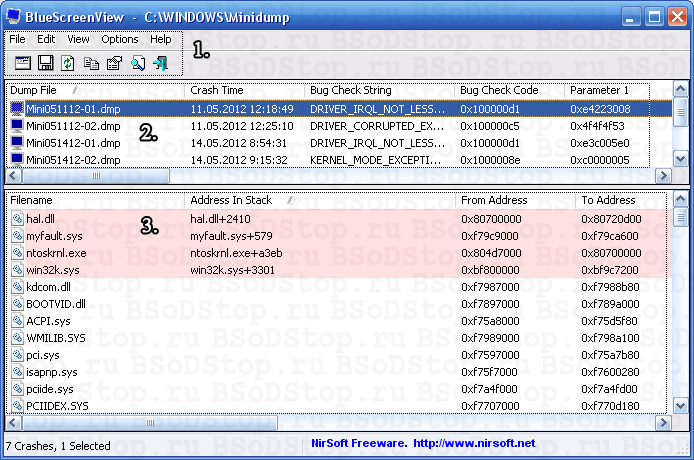
In the memory dump list block (marked with number 2 in the figure), select the dump we are interested in and look at the list of drivers that were loaded into RAM (marked with number 3 in the figure). Pink color drivers that were on the memory stack are colored. They are the cause of BSoD. Next, go to the Main Menu of the driver, determine which device or program they belong to. First of all, pay attention to system files, because system files are loaded in RAM in any case. It's easy to see that the faulty driver in the image is myfault.sys. I will say that this program was specifically launched to cause a Stop error. After identifying the faulty driver, you need to either update it or remove it from the system.
In order for the program to show a list of drivers located on the memory stack when a BSoD occurs, you need to go to the menu item “ Options“click on menu” LowerPaneMode” and select “ OnlyDriversFoundInStack” (or press the F7 key), and to show a screenshot of the error, select “ BlueScreeninXPStyle” (F8). To return to the list of all drivers, you must select “ AllDrivers” (F6).