Construct as complete a graph as possible. Constructing graphs based on their characteristics
Theoretical information
Note that in construction problems the solution must be sought among simple undirected graphs (i.e., graphs without multiple edges and without loops). Unfortunately, there is no universal technique that allows you to accurately determine whether a graph with given characteristics can be constructed.
It is important to remember that in any graph the sum of the degrees of all its vertices is an even number, equal to twice the number of edges of the graph, since each edge participates in this sum exactly twice. This result, known to Euler 200 years ago, is often called the handshake lemma. It follows from it that if several people shake hands, then the total number of handshakes is necessarily even, because two hands are involved in each handshake (each hand is counted as many times as it participated in handshakes). It follows that:
- the number of vertices with odd degrees in any graph is even;
- in any graph with n peaks where n> 2, there are always at least two vertices with the same degrees;
- if in a graph with vertices p> 2 exactly two vertices have the same degree, then in this graph there is always either exactly one vertex of degree 0 or exactly one vertex of degree (p - 1).
When solving problems, you must read the conditions very carefully, since many adjectives that describe the properties of a graph have numerical equivalents. We present a table of such correspondences that are most often found in the formulation of problems (Table 2.9).
After all the necessary numbers have been obtained, you need to try to calculate the missing characteristics of the graph. Sometimes the condition gives the degrees of all or several vertices. In this case, based on the fact that each edge of the graph adds exactly two vertices to its total degree, we can use the formula
X 5 (y /) =2t'
Where T - number of vertices, and the summation is carried out over all vertices from 1 to p.
Tasks
Problem 2.42. Construct a graph on eight vertices that has the following distribution of vertex degrees: two vertices of degree 4; three vertices of degree 3; two vertices of degree 2; one vertex of degree 1.
Solution.
The total degree of all vertices is 2-4 + 3- 3 + 2- 2+1 1=22, which means there are 11 edges in total. It is easier to build graphs based on a vector of degrees, starting from vertices of large degrees. Ver-
Table 2.9
Correspondence between the description of a graph and its properties
|
Adjective |
Numeral |
What does it mean |
|
The graph has exactly one connected component |
||
|
Incoherent |
The graph has more than one component, its diameter is exactly equal to infinity |
|
|
Regular |
5(U;) = SOSHI |
The degrees of all vertices are equal |
|
Regular degree |
з(Уі)=У |
The degrees of all vertices are equal u. If known n(number of vertices), then you can immediately calculate T(number of ribs): y-p? y/2 (n or at must be an even number) |
|
Acyclic |
y= t-p + k = 0 |
The cyclomatic number is zero, the graph has no cycles, it is a tree or a forest (depending on connectivity), such graphs can always be colored in two colors. If two out of three variables are known ( n, t, k), then using the formula you can find the remaining |
|
Tree (or acyclic connected graph) |
y=t-n+ 1 =0, whence T- n - 1 |
The cyclomatic number is zero, the graph has no cycles, it is a tree, such graphs can always be colored in two colors. If one of two variables is known ( n or T), then using the formula you can find the second |
|
Bichromatic |
The chromatic number of a graph is two, such graphs can always be colored in two colors, these are bipartite graphs, graphically they are either acyclic graphs or graphs in which all cycles have an even length |
It is better to arrange the buses in the graphical representation of the graph so that as few edges and arcs intersect as possible, and the vertices themselves are grouped according to some similarity criterion. One of the options is shown in Fig. 2.8.
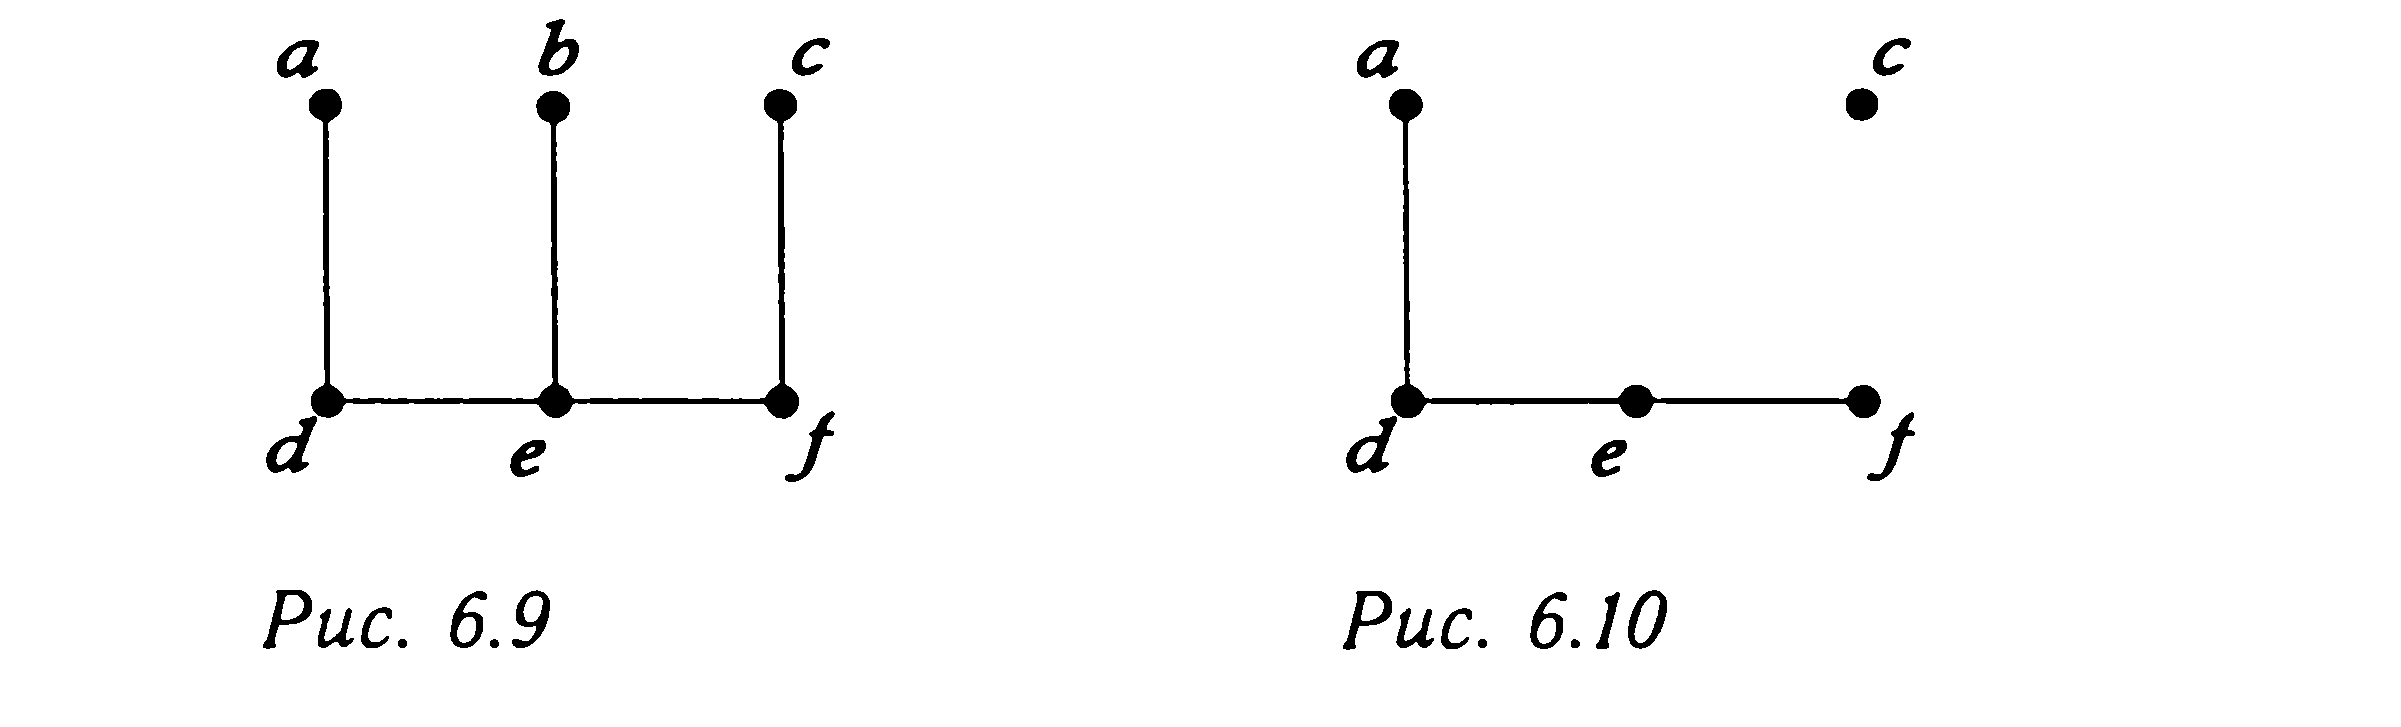
Problem 2.43. Construct a graph on six vertices that has the following distribution of vertex degrees: two vertices of degree 3;
Rice. 2.8.
two vertices of degree 2; one vertex of degree 1; one vertex has an arbitrary degree.
Solution.
The total degree of the vertices is 11, therefore, the remaining vertex must have an odd degree, i.e. 1,3 or 5. Thus, it is possible to construct three different graphs (Fig. 2.9).


Rice. 2.9.
Problem 2.44. Construct a graph with the following vector of vertex degrees: 5 = (1, 2, 2, 3, 4, 4, 5).
Solution.
The total degree is 5 + 8 + 3 + 4+1=21. Since this is an odd number, which contradicts the theorem (the number of edges is half this number, but 21 is not evenly divisible by 2).
Answer. No such graph exists.
Problem 2.45. Construct a graph with the following vector of vertex degrees: 5 = (1, 1,2, 2, 2, 4, 4, 4, 4).
Problem 2.46. Construct a graph with the following vector of vertex degrees: 5 = (5, 5, 6, 6, 6, 6, 6).
Problem 2.47. Construct a graph with the following vector of vertex degrees: 5 = (1, 1, 1,2, 3, 3, 3, 3, 5, 5, 5).
Problem 2.48. Construct a graph with the following vector of vertex degrees: 5 = (3, 3, 3, 3, 3, 3, 3, 7).
Problem 2.49. Construct a graph on six vertices that has the following distribution of vertex degrees: three vertices are of degree 5, and the other three vertices are of unknown degree.
Problem 2.50. Construct a graph on ten vertices, with twice as many edges as vertices, and the following distribution of vertex degrees: two vertices of degree 6; four vertices of degree 5; two vertices of degree 4; two vertices of arbitrary degree - or justify the impossibility of constructing such a graph.
Problem 2.51. Construct a graph on ten vertices that has the following distribution of vertex degrees: one vertex of degree 7; two vertices of degree 6; two vertices of degree 5; two vertices of degree 4; two vertices of degree 3; one vertex of degree 2 - or justify the impossibility of constructing such a graph.
Problem 2.52. Construct a graph on 11 vertices that has the following distribution of vertex degrees: one vertex of degree 7; two vertices of degree 6; two vertices of degree 5; two vertices of degree 4; two vertices of degree 3; one vertex of degree 2 - or justify the impossibility of constructing such a graph.
Graph theory is a branch of discrete mathematics that studies objects represented as individual elements (vertices) and connections between them (arcs, edges).
Graph theory originates from the solution of the problem of the Königsberg bridges in 1736 by the famous mathematician Leonard Euler(1707-1783: born in Switzerland, lived and worked in Russia).
Problem about the Königsberg bridges.
There are seven bridges in the Prussian town of Königsberg on the Pregal River. Is it possible to find a walking route that goes exactly once over each of the bridges and starts and ends in the same place?


A graph in which there is a route that starts and ends at the same vertex and passes along all the edges of the graph exactly once is calledEuler graph.
The sequence of vertices (maybe repeated) through which the desired route passes, like the route itself, is calledEuler cycle .
The problem of three houses and three wells.
There are three houses and three wells, somehow located on a plane. Draw a path from each house to each well so that the paths do not intersect. This problem was solved (it was shown that there is no solution) by Kuratovsky (1896 - 1979) in 1930.

The four color problem. Partitioning a plane into non-intersecting areas is called by card. Map areas are called adjacent if they have a common border. The task is to color the map in such a way that no two adjacent areas are painted with the same color. Since the end of the 19th century, a hypothesis has been known that four colors are enough for this. The hypothesis has not yet been proven.
The essence of the published solution is to try a large but finite number (about 2000) types of potential counterexamples to the four-color theorem and show that not a single case is a counterexample. This search was completed by the program in about a thousand hours of supercomputer operation.
It is impossible to check the resulting solution “manually” - the scope of enumeration is beyond the scope of human capabilities. Many mathematicians raise the question: can such a “program proof” be considered a valid proof? After all, there may be errors in the program...
Thus, we can only rely on the programming skills of the authors and believe that they did everything right.
Definition 7.1. Count G= G(V, E) is a collection of two finite sets: V – called many vertices and the set E of pairs of elements from V, i.e. EÍV´V, called many edges, if the pairs are unordered, or many arcs, if the pairs are ordered.
In the first case, the graph G(V, E) called unoriented, in the second – oriented.


EXAMPLE. A graph with a set of vertices V = (a,b,c) and a set of edges E =((a, b), (b, c))

EXAMPLE. A graph with V = (a,b,c,d,e) and E = ((a, b), (a, e), (b, e), (b, d), (b, c) , (c, d)),

If e=(v 1 ,v 2), еОЕ, then they say that the edge is e connects vertices v 1 and v 2.
Two vertices v 1,v 2 are called adjacent, if there is an edge connecting them. In this situation, each of the vertices is called incident corresponding edge .
Two different ribs adjacent, if they have a common vertex. In this situation, each of the edges is called incidental corresponding vertex .
Number of graph vertices G let's denote v, and the number of edges is e:
 .
.
The geometric representation of the graphs is as follows:
1) the vertex of the graph is a point in space (on the plane);
2) an edge of an undirected graph – a segment;
3) an arc of a directed graph – a directed segment.
Definition 7.2. If in the edge e=(v 1 ,v 2) v 1 =v 2 occurs, then the edge e is called loop. If a graph allows loops, then it is called graph with loops or pseudograph .
If a graph allows more than one edge between two vertices, then it is called multigraph .
If each vertex of a graph and/or edge is labeled, then such a graph is called marked (or loaded ). Letters or integers are usually used as marks.
Definition 7.3. Graph G (V , E ) called subgraph (or part ) graph G(V,E), If V V, E E. If V = V, That G called spanning subgraph G.
Example 7 . 1 . Given an undirected graph.


Definition 7.4. The graph is called complete , If any its two vertices are connected by an edge. Complete graph with n vertices is denoted by K n .
Counts K 2 , TO 3, TO 4 and K 5 .

Definition 7.5. Graph G=G(V, E) is called dicotyledonous , If V can be represented as a union of disjoint sets, say V=AB, so each edge has the form ( v i , v j), Where v i A And v j B.
Each edge connects a vertex from A to a vertex from B, but no two vertices from A or two vertices from B are connected.
A bipartite graph is called complete dicotyledon count K m , n, If A contains m peaks, B contains n vertices and for each v i A, v j B we have ( v i , v j)E.
Thus, for everyone v i A, And v j B there is an edge connecting them.
K 12 K 23 K 22 K 33

Example 7 . 2 . Construct a complete bipartite graph K 2.4 and the full graph K 4 .

Unit graphn-dimensional cubeIN n .
The vertices of the graph are n-dimensional binary sets. Edges connect vertices that differ in one coordinate.
Example: 
A graphics file format is a way of representing graphic data on external media. There are raster and vector formats of graphic files, among which, in turn, there are universal graphic formats and proprietary (original) formats of graphic applications.
Universal graphic formats are “understood” by all applications that work with raster (vector) graphics.
The universal raster graphic format is the BMP format. Graphic files in this format have a large information volume, since they allocate 24 bits to store information about the color of each pixel.
Drawings saved in the universal bitmap format GIF can only use 256 different colors. This palette is suitable for simple illustrations and pictograms. Graphic files of this format have a small information volume. This is especially important for graphics used on the World Wide Web,
users of which would like the information they requested to appear on the screen as quickly as possible.
The universal raster format JPEG is designed specifically for efficient storage of photographic-quality images. Modern computers can reproduce more than 16 million colors, most of which are simply indistinguishable to the human eye. The JPEG format allows you to discard the variety of colors of neighboring pixels that are “excessive” for human perception. Some of the original information is lost, but this ensures a reduction in the information volume (compression) of the graphic file. The user is given the opportunity to determine the degree of file compression. If the image being saved is a photograph that is supposed to be printed on a large-format sheet, then loss of information is undesirable. If this photograph is placed on a XL page, then it can be safely compressed tens of times: the remaining information will be enough to reproduce the image on the monitor screen.
Universal vector graphic formats include the WMF format, used to store a collection of Microsoft pictures (http://office.microsoft.com/ru-ru/clipart).
The universal EPS format allows you to store information about both raster and vector graphics. It is often used for imports! files into programs for preparing printed products.
You will become familiar with your own formats directly in the process of working with graphic applications. They provide the best ratio of image quality and file information volume, but are supported (i.e. recognized and played) only by the application itself that creates the file.
Problem 1. 3 bytes are used to encode one pixel. The photo, measuring 2048 x 1536 pixels, was saved as an uncompressed file. Determine the size of the resulting file. Solution.
I-k.i i-I/k
i-2. 1024 8/(128. 128) =
2 2 10 2 3 /(2 7 2 7) = 2 1 + 10 + 3 /2 7 + 7 2 14 /2 14 = 1 (bit). LG-21-2.
Answer: 2 colors - black and white.
THE MOST IMPORTANT
Computer graphics is a broad concept that refers to: 1) different types of graphic objects created or processed using computers; 2) an area of activity in which computers are used as tools for creating and processing graphic objects.
Depending on the method of creating a graphic image, raster and vector graphics are distinguished.
In raster graphics, an image is formed as a raster of a collection of dots (pixels) forming rows and columns. When a raster image is saved in computer memory, information about the color of each pixel included in it is stored.
In vector graphics, images are formed on the basis of data sets (vectors) describing a particular graphic object and formulas for their construction. When saving a vector image, information about the simplest geometric objects that make it up is entered into the computer memory.
A graphics file format is a way of representing graphic data on external media. There are raster and vector formats of graphic files, among which, in turn, there are universal graphic formats and proprietary formats of graphic applications.
a Questions and tasks
1. What is computer graphics?
2. List the main areas of application of computer graphics.
H. How can digital graphics be produced?
4. A color image measuring 10 x 15 cm is scanned. Scanner resolution is 600 x 600 dpi, color depth - 3 bytes. What information volume will the resulting graphic file have?
5. What is the difference between raster and vector methods of representing an image?
b. Why is it believed that raster images convey color very accurately?
7. Which operation of converting a raster image leads to the greatest loss of its quality - reduction or enlargement? How can you explain this?
8. Why does scaling not affect the quality of vector images?
9. How can you explain the variety of graphic file formats?
| Computer graphics |
10. What is the main difference between universal graphics formats and proprietary graphics application formats?
11. Construct as complete a graph as possible for the concepts in section 3.2.4.
12. Give a detailed description of raster and vector images, indicating the following:
a) from what elements the image is built;
b) what information about the image is stored in external memory;
c) how the size of a file containing a graphic image is determined;
d) how image quality changes when scaling;
e) what are the main advantages and disadvantages of raster (vector) images.
13. A drawing measuring 1024 x 512 pixels was saved as an uncompressed file of 1.5 MB in size. How much information was used to encode the pixel's color? What is the maximum possible number of colors in a palette corresponding to this color depth?
14. An uncompressed raster image of 256 x 128 pixels takes up 16 KB of memory. What is the maximum possible number of colors in the image palette?
Graph theory- one of the most extensive sections of discrete mathematics, widely used in solving economic and management problems, in programming, chemistry, design and study of electrical circuits, communications, psychology, psychology, sociology, linguistics, and other fields of knowledge. Graph theory systematically and consistently studies the properties of graphs, which can be said to consist of sets of points and sets of lines representing the connections between these points. The founder of graph theory is considered to be Leonhard Euler (1707-1882), who solved the then well-known problem of the Königsberg bridges in 1736.
Graphs are built in order to display relations on sets. Let, for example, be a set A = {a1 , a 2 , ... a n)- a lot of people, and each element will be displayed as a dot. Many B = {b1 , b 2 , ... b m)- many connections (straight lines, arcs, segments - it doesn’t matter yet). On set A the relationship of acquaintance between people from this set is given. Building a graph from points and connectives. Links will connect pairs of people who know each other. Naturally, the number of acquaintances of some people may differ from the number of acquaintances of other people, and some may well not know anyone (such elements will be points not connected to any other). So we have a graph!
What we first called “points” should be called the vertices of the graph, and what we called “connections” should be called the edges of the graph.
Graph theory does not take into account the specific nature of sets A And B. There are a large number of very different specific problems, when solving which one can temporarily forget about the specific content of sets and their elements. This specificity does not in any way affect the progress of solving the problem, regardless of its difficulty! For example, when deciding whether it is possible from a point a get to the point e, moving only along the lines connecting the points, it does not matter whether we are dealing with people, cities, numbers, etc. But when the problem is solved, we get a solution that is true for any content that was modeled as a graph. It is not surprising, therefore, that graph theory is one of the most popular tools in the creation of artificial intelligence: after all, artificial intelligence can discuss with an interlocutor issues of love, issues of music or sports, and issues of solving various problems, and does this without any transition (switching) , without which a person cannot do without in such cases.
And now the strict mathematical definitions of a graph.
Definition 1.It's called a graph a system of objects of arbitrary nature (vertices) and links (edges) connecting some pairs of these objects.
Definition 2. Let V– (non-empty) set of vertices, elements v∈V- peaks. Graph G = G(V) with many vertices V there is a certain family of pairs of the form: e = (a, b) , Where a,b∈V , indicating which vertices remain connected. Each pair e = (a, b) - edge of the graph. Many U- many edges e graph. Peaks a And b– end points of the edge e .
Graphs as a data structure. The widespread use of graph theory in computer science and information technology is due to the addition of the concept of a graph as a data structure to the above definitions. In computer science and information technology, a graph is defined as a nonlinear data structure. What then is a linear data structure and how do graphs differ from them? Linear data structures are characterized by the fact that they connect elements through relationships of the “simple neighborhood” type. Linear data structures are, for example, arrays, tables, lists, queues, stacks, strings. In contrast, nonlinear data structures are those in which elements are located at different levels of the hierarchy and are divided into three types: original, generated, and similar. So, a graph is a nonlinear data structure.
The word graph is of Greek origin, from the words “I write”, “I describe”. From the beginning of this article we know what exactly the graph describes: it describes relationships. That is, any graph describes relationships. And vice versa: any relationship can be described as a graph.
Basic concepts of graph theory
The concept of incidence is also necessary when developing algorithms for solving many practical problems with graphs. For example, you can familiarize yourself with the software implementation depth-first traversal of the graph represented by the incidence matrix. The idea is simple: you can only move through vertices connected by edges. And if some values are assigned to the edges ("scales", most often in the form of numbers, such graphs are called weighted or labeled), then complex applied problems can be solved, some of which are mentioned in the final paragraph of this lesson.
Classical problems of graph theory and their solutions
One of the first published examples of work on graph theory and the application of graphs is the work on the “Königsberg Bridges Problem” (1736), authored by the eminent 18th century mathematician Leonhard Euler. The problem contains a river, islands that are washed by this river, and several bridges. Question of the problem: is it possible, after leaving a certain point, to cross each bridge only once and return to the starting point? (picture below)
The problem can be modeled as follows: one point is attached to each land area, and two points are connected by a line if and only if the corresponding land areas are connected by a bridge (figure below, connecting lines are drawn in dotted lines). Thus, the graph is constructed.

Euler's answer to the problem question is as follows. If this problem had a positive solution, then in the resulting graph there would be a closed path passing along the edges and containing each edge only once. If such a path exists, then each vertex must have only an even number of edges. But the resulting graph has vertices that have an odd number of edges. Therefore, the problem does not have a positive solution.
According to established tradition, an Eulerian graph is a graph in which it is possible to traverse all the vertices and at the same time traverse one edge only once. In it, each vertex must have only an even number of edges. A problem of medium difficulty on Euler graphs is in the material “Basic types of graphs”.
In 1847, Kirchhoff developed the theory of trees to solve a simultaneous system of linear algebraic equations, allowing one to find the value of the current in each conductor (arc) and in each circuit of an electrical circuit. Abstracting from electrical circuits and circuits that contain resistances, capacitors, inductances, etc., he considered the corresponding combinatorial structures containing only vertices and connections (edges or arcs), and for connections there is no need to take into account what types of electrical elements they correspond to . Thus, Kirchhoff replaced each electrical circuit with a corresponding graph and showed that to solve a system of equations it is not necessary to consider each cycle of the electrical circuit graph separately.
Cayley in 1858, while working on purely practical problems in organic chemistry, discovered an important class of graphs called trees. He sought to list the isomers of saturated hydrocarbons, with a given number of carbon atoms. Cayley first formulated the problem abstractly: find the number of all trees with p vertices, each of which has vertices with degrees 1 and 4. He was unable to immediately solve this problem, and he began to change its formulation in such a way that a new enumeration problem could be solved:
- rooted trees (in which one of the vertices is selected);
- all trees;
- trees whose vertex degrees do not exceed 4;
- trees whose vertex degrees are 1 and 4 (statement of a problem from chemistry).
Graph problems to reinforce basic concepts
Example 1. Let A- set of numbers 1, 2, 3: A= (1, 2, 3) . Construct a graph to display the relationship "
Solution. Obviously, the numbers 1, 2, 3 should be represented as the vertices of a graph. Then each pair of vertices must be connected by one edge. Solving this problem, we came to such basic concepts of graph theory as directed and undirected graphs. Undirected graphs are those whose edges have no direction. Or, as they say even more often, the order of the two ends of an edge is not significant. In fact, the graph constructed at the very beginning of this lesson and reflecting the relationship of acquaintance between people does not need edge directions, since it can be argued that “person number 1” is familiar with “person number 2” to the same extent as "person number 2" with "person number 1". In our current example, one number is less than another, but not vice versa. Therefore, the corresponding edge of the graph must have a direction indicating which number is less than the other. That is, the order of the edge ends is significant. Such a graph (with edges having a direction) is called a directed graph or digraph.
So, in our multitude A number 1 is less than number 2 and number 3, and number 2 is less than number 3. We display this fact by edges that have a direction, which is shown by arrows. We get the following graph:
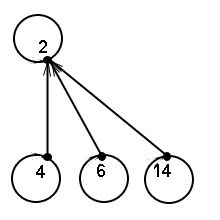
Example 2. Let A- set of numbers 2, 4, 6, 14: A= (2, 4, 6, 14) . Create a graph to display the “divisible by” relation on this set.
Solution. In this example, some of the edges will have a direction, and some will not, that is, we are building mixed graph. Let's list the relations on the set: 4 is divisible by 2, 6 is divisible by 2, 14 is divisible by 2, and each number from this set is divisible by itself. This relation, that is, when a number is divisible by itself, will be displayed in the form of edges that connect the vertex to itself. Such edges are called loops. In this case there is no need to give direction to the loop. So in our example there are three regular directed edges and four loops. We get the following graph:
Example 3. Let given sets A= (α, β, γ) and B= (a, b, c) . Construct a graph to display the relationship “Cartesian product of sets.”
Solution. As is known from the definition Cartesian product of sets, there are no ordered sets of elements of the same set. That is, in our example, you cannot combine Greek letters with Greek and Latin with Latin. This fact is displayed as bipartite graph, that is, one in which the vertices are divided into two parts so that the vertices belonging to the same part are not connected to each other. We get the following graph:

Example 4. The real estate agency employs managers Igor, Sergey and Peter. Objects O1, O2, O3, O4, O5, O6, O7, O8 are serviced. Construct a graph to display the relationships “Igor works with objects O4, O7”, “Sergey works with objects O1, O2, O3, O5, O6”, “Peter works with object O8”.
Solution. The graph displaying these relationships will also be bipartite, since the manager does not work with the manager and the object does not work with the object. However, unlike the previous example, the graph will be directed. In fact, for example, Igor works with object O4, but object O4 does not work with Igor. Often, when such a property of relations is obvious, the need to give direction to the edges may seem like “mathematical stupidity.” But still, and this follows from the strict nature of mathematics, if the relationship is one-sided, then it is necessary to give directions to the edges. In relational applications, this rigor pays off, for example, in programs designed for planning, where graphs are also used and the route along vertices and edges must pass strictly in a given direction. So, we get the following directed bipartite graph:

And again to examples with numbers.
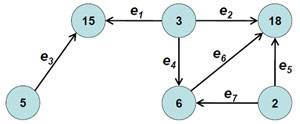
Example 5. Let a set be given C = {2, 3, 5, 6, 15, 18} . Construct a graph that implements a relation defining all pairs of numbers a And b from many C, in which, when dividing the second element by the first, we obtain a quotient that is an integer greater than 1.
Solution. The graph displaying these relationships will be oriented, since the condition contains a mention of the second and first elements, that is, the edge will be directed from the first element to the second. From this it is clearly clear which element is the first and which the second. Let's also add some terminology: oriented edges are usually called arcs. There will be 7 arcs in our graph: e1 = (3, 15) , e2 = (3, 18) , e3 = (5, 15) , e4 = (3, 6) , e5 = (2, 18) , e6 = (6, 18) , e7 = (2, 6) . In this example, the edges (arcs) of the graph are simply numbered, but serial numbers are not the only thing that can be assigned to an arc. The arc can also be attributed to scales meaning, for example, the cost of sending cargo from one point to another. But we will get acquainted with arc weights later and in more detail. So, we get the following directed graph:
As we already know from the theoretical introductory part, graph theory does not take into account the specific nature of sets and, using the same graph, one can define relations on sets with very different contents. That is, this very content can be abstracted from when modeling a task. Let's move on to examples that illustrate this remarkable property of graph theory.
Example 6. On a piece of a chessboard measuring 3 X 3, two white knights and two black knights are placed as shown in the figure below.
Is it possible to move the knights to the state shown in the following figure, not forgetting that two pieces cannot be on the same square?
Solution. In the constructed graph, pairs of vertices will be connected by the “knight move” relation. That is, one vertex is the one from which the knight left, and the other is the one to which it arrived, and the intermediate cell of the letter “r” will be outside this relationship. We get the following graph:
And yet the design turned out to be cumbersome. The cells of a chessboard are visible in it, and many of the edges of the graph intersect. Is it possible to abstract from the physical appearance of the chessboard and imagine the relationship more simply? It turns out that it is possible. In the new graph, the neighboring vertices will be those that are connected by the “knight move” relationship, and not those neighboring on the chessboard (figure below).
Now it is easy to see that the answer to the question of this problem is negative. In the initial state there is no black knight between two white knights, but in the final state there must be this black knight. The edges of the graph are placed so that two adjacent knights cannot jump over each other.
Example 7. The problem about the wolf, the goat and the cabbage. On one bank of the river there are a man (H), a boat, a wolf (V), a goat (Kz) and a cabbage (Kp). A person and no more than one of the transported objects can be in the boat at the same time. A person must transport all objects to the other side, observing the condition: a wolf must not be left unattended with a goat and a goat with cabbage.
Solution. In the constructed graph, the vertices are configurations, and the edges are the “connection by one boat ride” relationship between the configurations. Configuration means the arrangement of objects on the original bank and on the opposite bank. Each configuration is displayed as ( A|B) , Where A- objects located on the original shore, and B- objects located on the opposite bank. The initial configuration is therefore - (PMCpKz| ) . For example, after transporting a goat to the other side, the configuration will be (VKp|ChKz) . The final configuration is always ( |PMCpKz) . Now we can build a graph, already knowing what the vertices and edges mean:

Let's place the vertices of the graph so that the edges do not intersect, and the neighboring vertices are those that are connected by a relationship on the graph. Then it will be much easier to see the relationships (to enlarge the picture, left-click on it):

As we can see, there are two different continuous routes from the initial configuration to the final one. Therefore, the problem has two different solutions (and both are correct).
Graph theory and the most important modern applied problems
Based on graph theory, methods have been developed for solving applied problems in which very complex systems are modeled in the form of graphs. In these models, nodes contain individual components, and edges represent connections between components. Typically, weighted graphs are used to model transport networks, queuing systems, and network planning. We have already talked about them; these are graphs in which weights are assigned to the arcs.
Tree graphs are used, for example, to construct decision trees(serve for risk analysis, analysis of possible gains and losses under conditions of uncertainty). Using graph theory, developed and other numerous mathematical models to solve problems in specific subject areas.
Graphs and the flow problem
Statement of the problem. There is a system of water pipes, represented by the graph in the figure below.
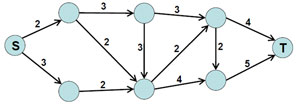
Each arc of the graph represents a pipe. The numbers above the arcs (scales) are the pipe capacity. Nodes are places where pipes are connected. Water flows through pipes in only one direction. Knot S- water source, node T- stock. It is required to maximize the volume of water flowing from source to drain.
To solve the flow problem, you can use the Ford-Fulkerson method. The idea of the method: the search for the maximum flow is carried out in steps. At the beginning of the algorithm, the flow is set to zero. At each subsequent step, the value of the flow increases, for which a complementary path is sought through which the additional flow arrives. These steps are repeated as long as additional paths exist. The problem has been successfully applied in various distributed systems: power supply system, communication network, railway system and others.
Graphs and network planning
In planning problems of complex processes consisting of many jobs, some of which are performed in parallel and some sequentially, weighted graphs, known as PERT networks, have become widely used.
PERT - Program (Project) Evaluation and Review Technique - a technique for evaluating and analyzing programs (projects), which is used in project management.
The PERT network is a weighted acyclic directed graph in which each arc represents a job (action, operation), and the weight of the arc is the time required to complete it.
If there are arcs in the network ( a, b) And ( b, c) , then the work represented by the arc ( a, b) must be completed before the work represented by the arc ( b, c) . Each vertex ( vi) represents the point in time by which all work, defined by arcs ending at a vertex ( vi).
In a column like this:
- one vertex, which has no predecessors, determines the start time of work;
- one vertex, which has no followers, corresponds to the moment in time when the set of works is completed.
The path of maximum length between these vertices of the graph (from the beginning to the end of the work process) is called the critical path. To reduce the time required to complete the entire complex of work, it is necessary to find work that lies on the critical path and reduce its duration by, for example, attracting additional performers, mechanisms, and new technologies.

The entire block "Graph Theory"
It is advisable to introduce the concept of a graph after several problems similar to Problem 1 have been analyzed, the decisive consideration in which is graphical representation. It is important that students immediately realize that the same graph can be drawn in different ways. In my opinion, there is no need to give a strict definition of a graph, because it is too cumbersome and will only complicate the discussion. At first, an intuitive concept will suffice. When discussing the concept of isomorphism, you can solve several exercises to identify isomorphic and non-isomorphic graphs. One of the central points of the topic is the theorem on the parity of the number of odd vertices. It is important that students fully understand its proof and learn how to apply it to problem solving. When analyzing several problems, I recommend not referring to the theorem, but actually repeating its proof. The concept of graph connectivity is also extremely important. A meaningful consideration here is the consideration of the connectivity component; special attention must be paid to this. Euler graphs are almost a game topic.
The first and main goal that needs to be pursued when studying graphs is to teach schoolchildren to see the graph in the problem statement and to correctly translate the condition into the language of graph theory. You shouldn’t tell both of them to everyone in several classes in a row. It is better to spread classes over 2–3 academic years. (Attached is the development of the lesson “The concept of a graph. Application of graphs to problem solving” in 6th grade).
2. Theoretical material for the topic “Graphs”.
Introduction
Graphs are wonderful mathematical objects; with their help you can solve a lot of different, outwardly dissimilar problems. There is a whole section in mathematics - graph theory, which studies graphs, their properties and applications. We will discuss only the most basic concepts, properties of graphs and some ways to solve problems.
Concept of a graph
Let's consider two problems.
Task 1. Space communication has been established between the nine planets of the solar system. Regular rockets fly on the following routes: Earth - Mercury; Pluto - Venus; Earth - Pluto; Pluto - Mercury; Mercury - Vienna; Uranus - Neptune; Neptune - Saturn; Saturn – Jupiter; Jupiter - Mars and Mars - Uranus. Is it possible to fly on regular rockets from Earth to Mars?
Solution: Let's draw a diagram of the condition: we will depict the planets as points, and the rocket routes as lines.
Now it is immediately clear that it is impossible to fly from Earth to Mars.
Task 2. The board has the shape of a double cross, which is obtained by removing the corner squares from a 4x4 square.

Is it possible to bypass it by moving a chess knight and return to the original square, visiting all the squares exactly once?
Solution: Let's number the squares of the board sequentially:
And now, using the figure, we will show that such a traversal of the table, as indicated in the condition, is possible:

We considered two dissimilar problems. However, the solutions to these two problems are united by a common idea - a graphical representation of the solution. At the same time, the pictures drawn for each task turned out to be similar: each picture consists of several dots, some of which are connected by lines.
Such pictures are called graphs. The points are called peaks, and the lines – ribs graph. Note that not every picture of this type will be called a graph. For example. if you are asked to draw a pentagon in your notebook, then such a drawing will not be a graph. We will call a drawing of this type, as in the previous problems, a graph if there is some specific task for which such a drawing was constructed.
Another note concerns the appearance of the graph. Try to check that the graph for the same problem can be drawn in different ways; and vice versa, for different tasks you can draw graphs of the same appearance. All that matters here is which vertices are connected to each other and which are not. For example, the graph for task 1 can be drawn differently:

Such identical, but differently drawn graphs are called isomorphic.
Degrees of vertices and counting the number of edges of a graph
Let's write down one more definition: The degree of a vertex in a graph is the number of edges emerging from it. In this regard, a vertex with an even degree is called an even vertex, respectively, a vertex with an odd degree is called an odd vertex.
One of the main theorems of graph theory is related to the concept of vertex degree - the theorem on the fairness of the number of odd vertices. We will prove it a little later, but first, for illustration, we will consider the problem.
Task 3. There are 15 telephones in the town of Malenky. Is it possible to connect them with wires so that each phone is connected to exactly five others?
Solution: Let's assume that such a connection between telephones is possible. Then imagine a graph in which the vertices represent telephones, and the edges represent the wires connecting them. Let's count how many wires there are in total. Each phone has exactly 5 wires connected, i.e. the degree of each vertex of our graph is 5. To find the number of wires, you need to sum up the degrees of all the vertices of the graph and divide the resulting result by 2 (since each wire has two ends, then when summing the degrees, each wire will be taken 2 times). But then the number of wires will be different. But this number is not an integer. This means that our assumption that each phone can be connected to exactly five others turned out to be incorrect.
Answer. It is impossible to connect phones this way.
Theorem: Any graph contains an even number of odd vertices.
Proof: The number of edges of a graph is equal to half the sum of the degrees of its vertices. Since the number of edges must be an integer, the sum of the degrees of the vertices must be even. And this is only possible if the graph contains an even number of odd vertices.
Graph connectivity
There is another important concept related to graphs - the concept of connectivity.
The graph is called coherent, if any two of its vertices can be connected by, those. continuous sequence of edges. There are a number of problems whose solution is based on the concept of graph connectivity.
Task 4. There are 15 cities in the country of Seven, each city is connected by roads to at least seven others. Prove that it is fashionable to get from every city to any other.
Proof: Consider two arbitrary cities A and B and assume that there is no path between them. Each of them is connected by roads to at least seven others, and there is no city that is connected to both cities in question (otherwise there would be a path from A to B). Let's draw a part of the graph corresponding to these cities:

Now it is clearly visible that we have received at least 16 different cities, which contradicts the conditions of the problem. This means the statement has been proven by contradiction.
If we take into account the previous definition, then the statement of the problem can be reformulated in another way: “Prove that the road graph of the country Seven is connected.”
Now you know what a connected graph looks like. A disconnected graph has the form of several “pieces”, each of which is either a separate vertex without edges or a connected graph. You can see an example of a disconnected graph in the figure:

Each such individual piece is called connected component of the graph. Each connected component represents a connected graph and all the statements that we proved for connected graphs hold for it. Let's look at an example of a problem that uses a connected component:
Problem 5. In the Far Far Away Kingdom there is only one type of transport - a flying carpet. There are 21 carpet lines leaving the capital, one from the city of Dalniy, and 20 from all other cities. Prove that you can fly from the capital to the city of Dalniy.
Proof: It is clear that if you draw a graph of the carpet of the Kingdom, it may be incoherent. Let's look at the connectivity component that includes the Kingdom capital. There are 21 carpets coming out of the capital, and 20 from any other city except the city of Dalniy, therefore, in order for the law on an even number of odd vertices to be fulfilled, it is necessary that the city of Dalniy be included in the same component of connectivity. And since the connected component is a connected graph, then from the capital there is a path along the carpets to the city of Dalniy, which was what needed to be proved.
Euler graphs
You've probably encountered tasks in which you need to draw a shape without lifting your pencil from the paper and drawing each line only once. It turns out that such a problem is not always solvable, i.e. There are figures that cannot be drawn using this method. The question of the solvability of such problems is also included in graph theory. It was first explored in 1736 by the great German mathematician Leonhard Euler, solving the problem of the Königsberg bridges. Therefore, graphs that can be drawn in this way are called Euler graphs.
Task 6. Is it possible to draw the graph shown in the figure without lifting the pencil from the paper and drawing each edge exactly once?

Solution. If we draw the graph as stated in the condition, then we will enter each vertex, except the initial and final ones, the same number of times as we exit it. That is, all vertices of the graph, except two, must be even. Our graph has three odd vertices, so it cannot be drawn in the way specified in the condition.
Now we have proven the theorem about Euler graphs:
Theorem: An Euler graph must have at most two odd vertices.
And in conclusion - the problem of the Königsberg bridges.
Task 7. The figure shows a diagram of bridges in the city of Königsberg.
Is it possible to take a walk so that you cross each bridge exactly once?

3. Problems for the topic “Graphs”
The concept of a graph.
1. On a 3x3 square board, 4 knights are placed as shown in Fig. 1. Is it possible, after making several moves with the knights, to move them to the position shown in Fig. 2?
Rice. 1 |
Rice. 2 |
Solution. Let's number the squares of the board as shown in the figure:
Let us assign a point on the plane to each cell, and if one cell can be reached by moving a chess knight from one cell, then we will connect the corresponding points with a line. The initial and required placement of the knights are shown in the figures:
 |
 |
For any sequence of knight moves, their order obviously cannot change. Therefore, it is impossible to rearrange the horses in the required manner.
2. In the country of Digit there are 9 cities with names 1, 2, 3, 4, 5, 6, 7, 8, 9. A traveler discovered that two cities are connected by an airline if and only if the two-digit number formed by the names cities, divided by 3. Is it possible to fly by air from city 1 to city 9?
Solution. By assigning a dot to each city and connecting the dots with a line, if the sum of the numbers is divisible by 3, we get a graph in which the numbers 3, 5, 9 are connected to each other, but not connected to the rest. This means that you cannot fly from city 1 to city 9.
Degrees of vertices and counting the number of edges.
3. There are 100 cities in a state, and each city has 4 roads. How many roads are there in the state?
Solution. Let's count the total number of roads leaving the city - 100 . 4 = 400. However, with this calculation, each road is counted 2 times - it leaves one city and enters another. This means that there are two times fewer roads in total, i.e. 200.
4. There are 30 people in the class. Could it be that 9 people have 3 friends, 11 have 4 friends, and 10 have 5 friends?
Answer. No (theorem on the parity of the number of odd vertices).
5. The king has 19 vassals. Could it be that each vassal has 1, 5 or 9 neighbors?
Answer. No, it can't.
6. Can a state in which exactly 3 roads exit from each city have exactly 100 roads?
Solution. Let's count the number of cities. The number of roads is equal to the number of cities x multiplied by 3 (the number of roads leaving each city) and divided by 2 (see problem 3). Then 100 = 3x/2 => 3x = 200, which cannot happen with natural x. This means there cannot be 100 roads in such a state.
7. Prove that the number of people who have ever lived on Earth and made an odd number of handshakes is even.
The proof follows directly from the theorem on the parity of the number of odd vertices in a graph.
Connectivity.
8. In the country, 100 roads leave each city and from each city you can get to any other. One road was closed for repairs. Prove that now you can get from any city to any other.
Proof. Let's consider the connectivity component, which includes one of the cities, the road between which was closed. By the theorem on the parity of the number of odd vertices, it also includes the second city. This means you can still find a route and get from one of these cities to another.
Euler graphs.
9. There is a group of islands connected by bridges so that from each island you can get to any other. The tourist walked around all the islands, crossing each bridge once. He visited Threefold Island three times. How many bridges lead from Troyekratnoye if a tourist
a) didn’t start with it and didn’t end with it?
b) started with it, but didn’t finish with it?
c) started with it and ended with it?
10. The picture shows a park divided into several parts by fences. Is it possible to walk through the park and its surroundings so that you can climb over each fence once?
